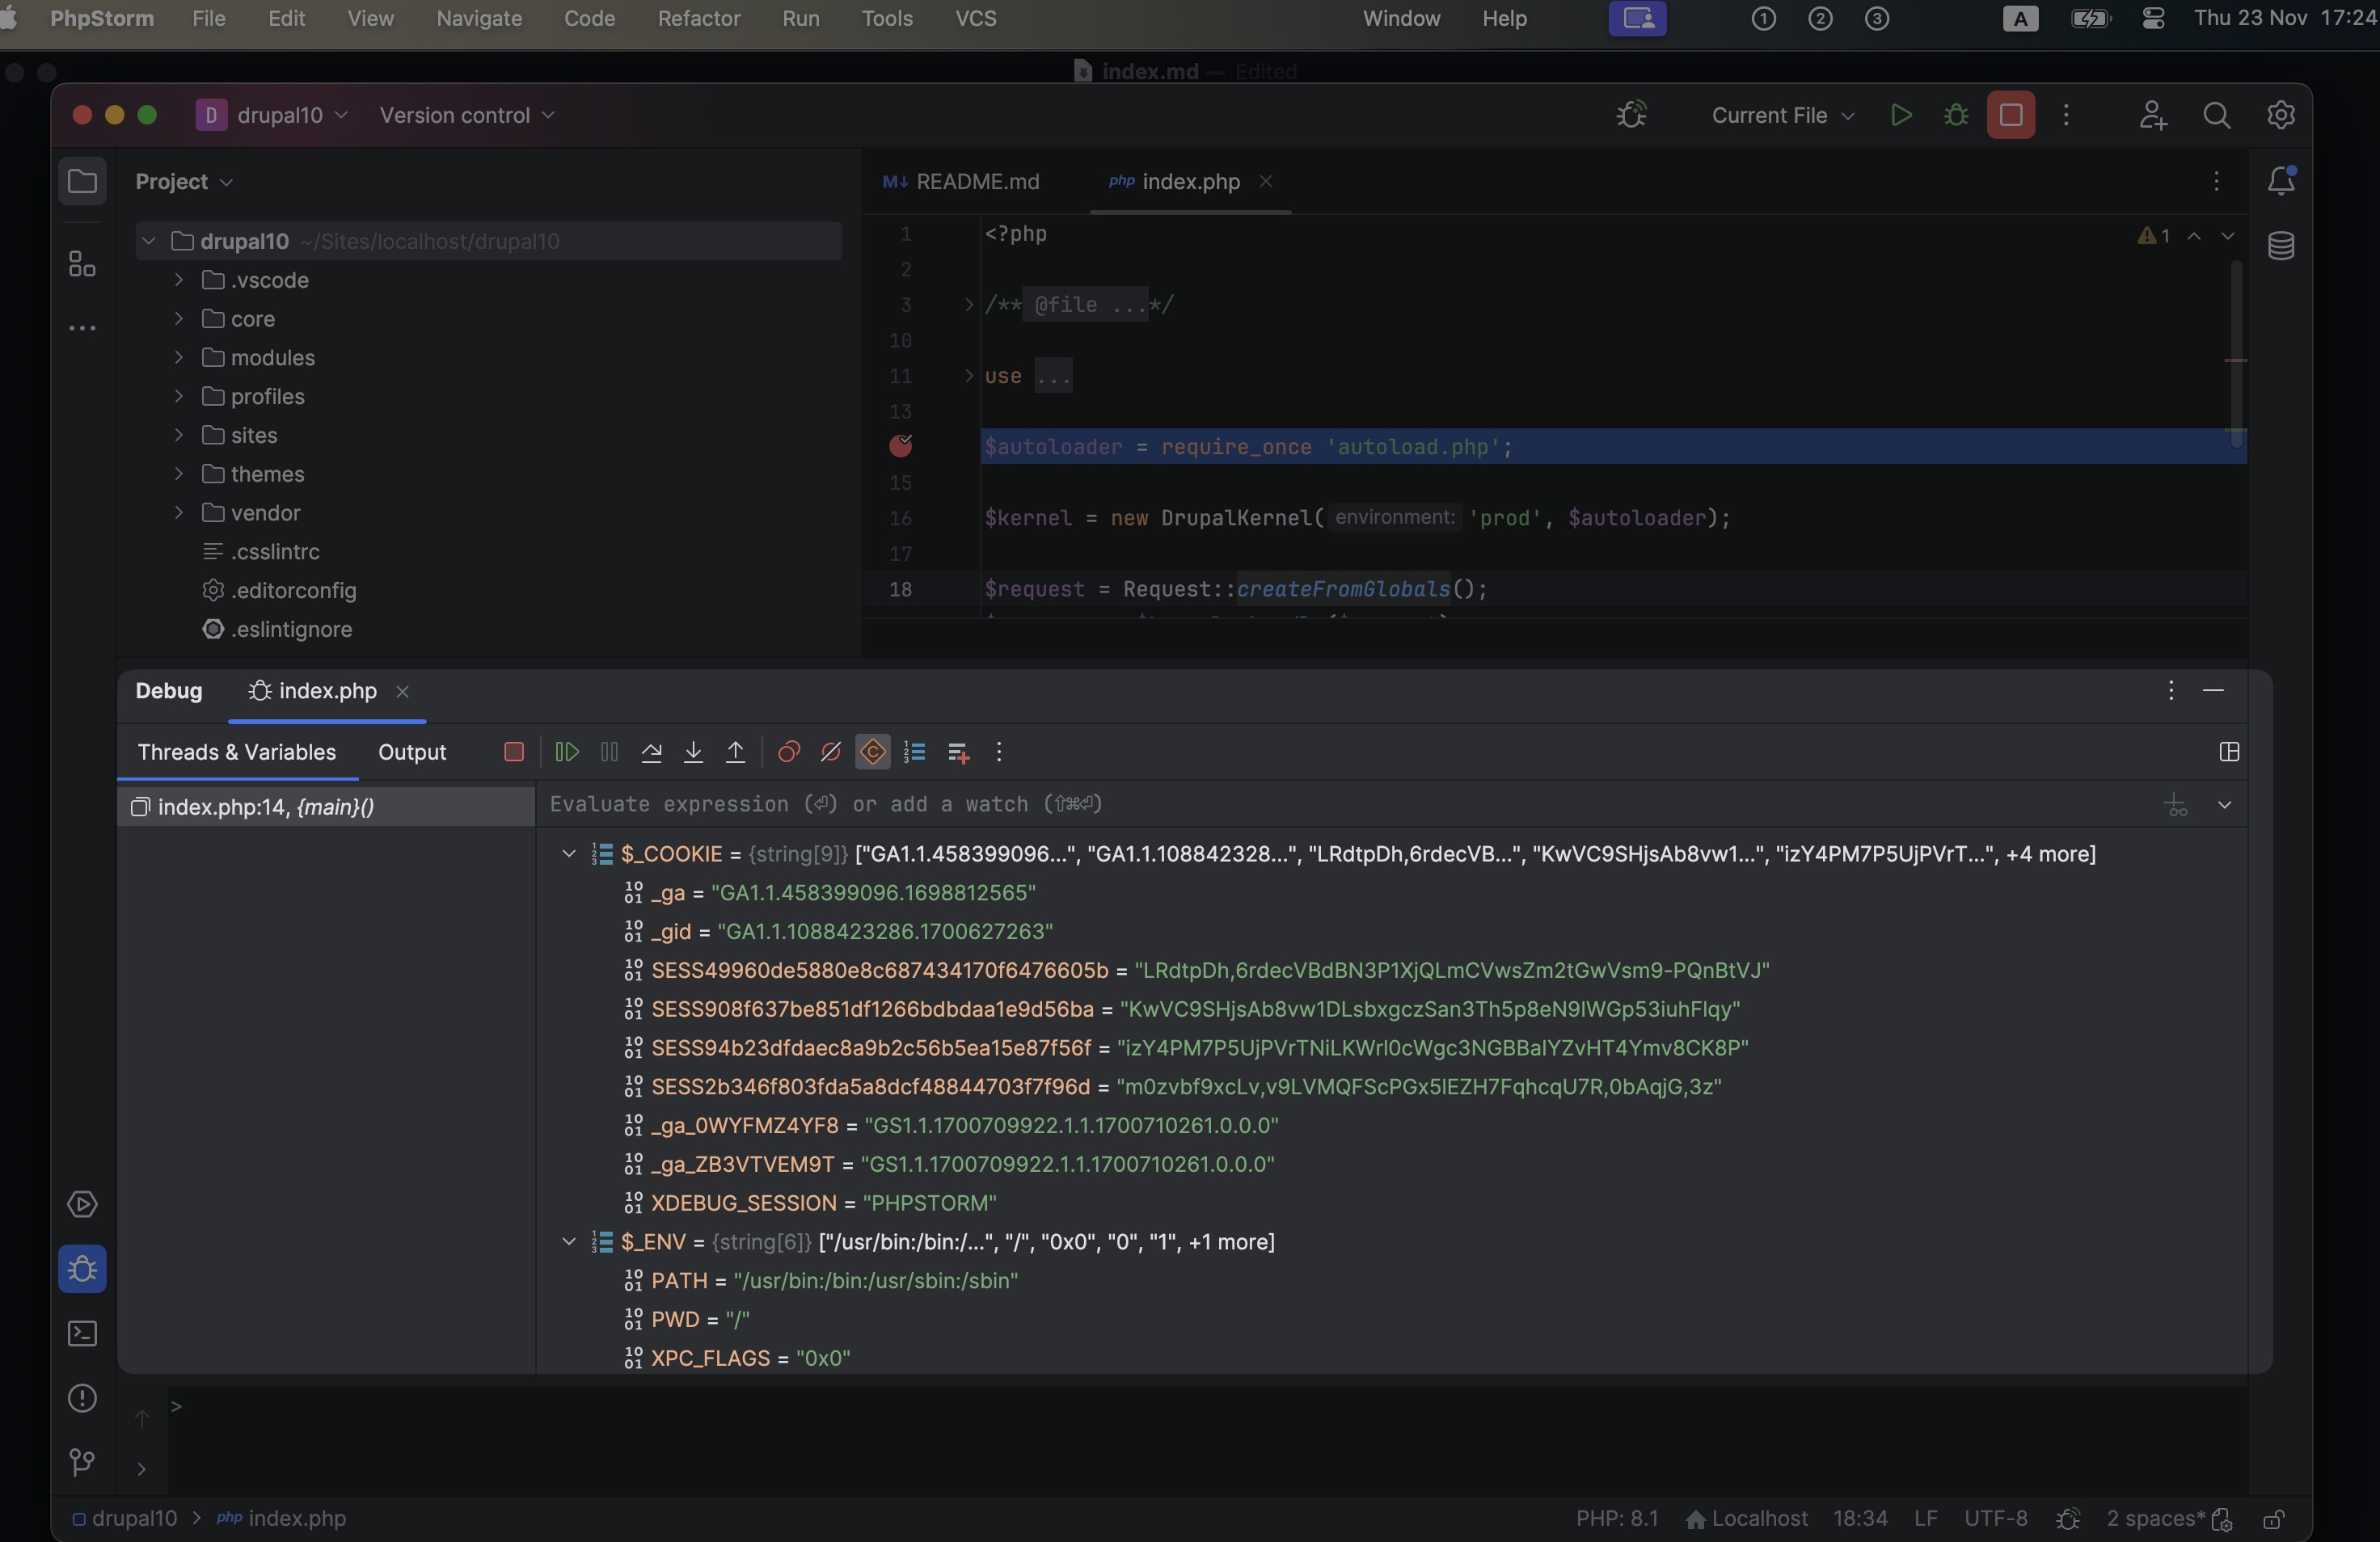
Note: This post focuses on developing a Drupal website on a MacOS machine using MAMP & MAMP Pro hosting software, Apache HTTP Server, and MySQL Backend. The goal is to debug the PHP file to access the variables available in a Twig template.
In the previous post we have successfully turn on the xdebug in php, and now we will setup the PhpStorm, and using it to add a breakpoint on the php file index.php, and use it to inspect the variables in the scope of the breakpoint.
Creating New Project
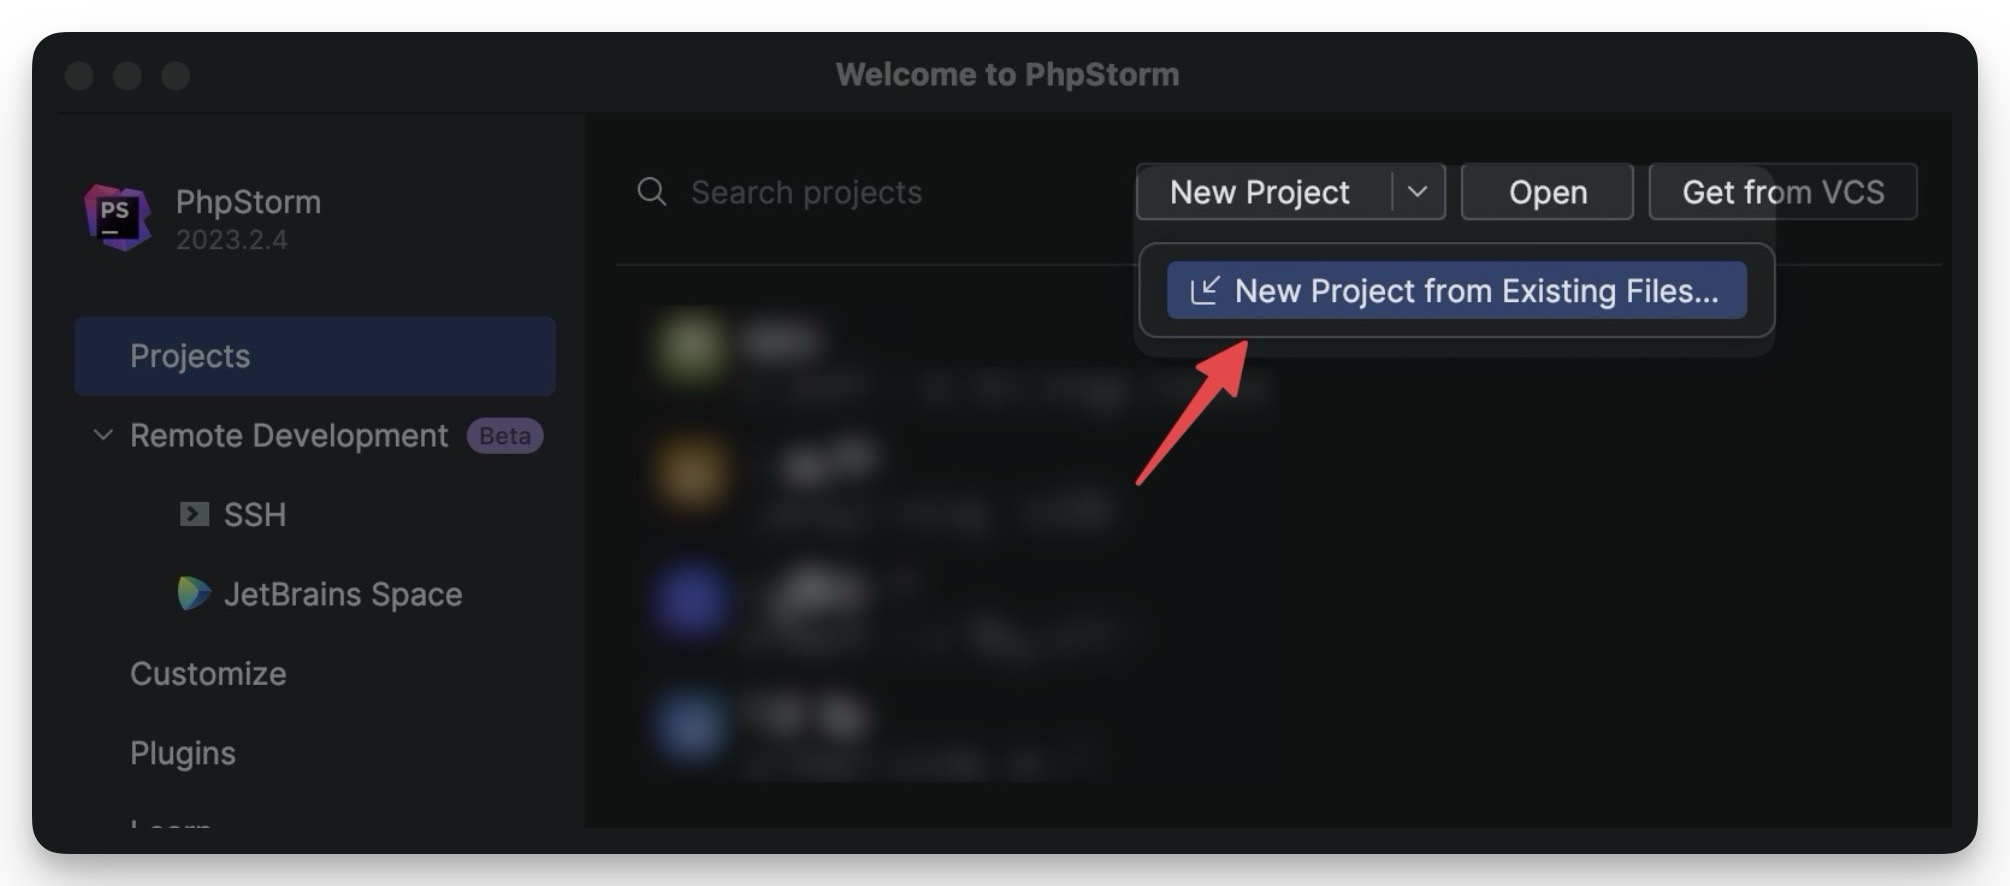
To begin with, you would like to create “new project from existing file”:
(for my instance i would like to use it to debug the project located at: “/Users/.../Sites/localhost/drupal10”)

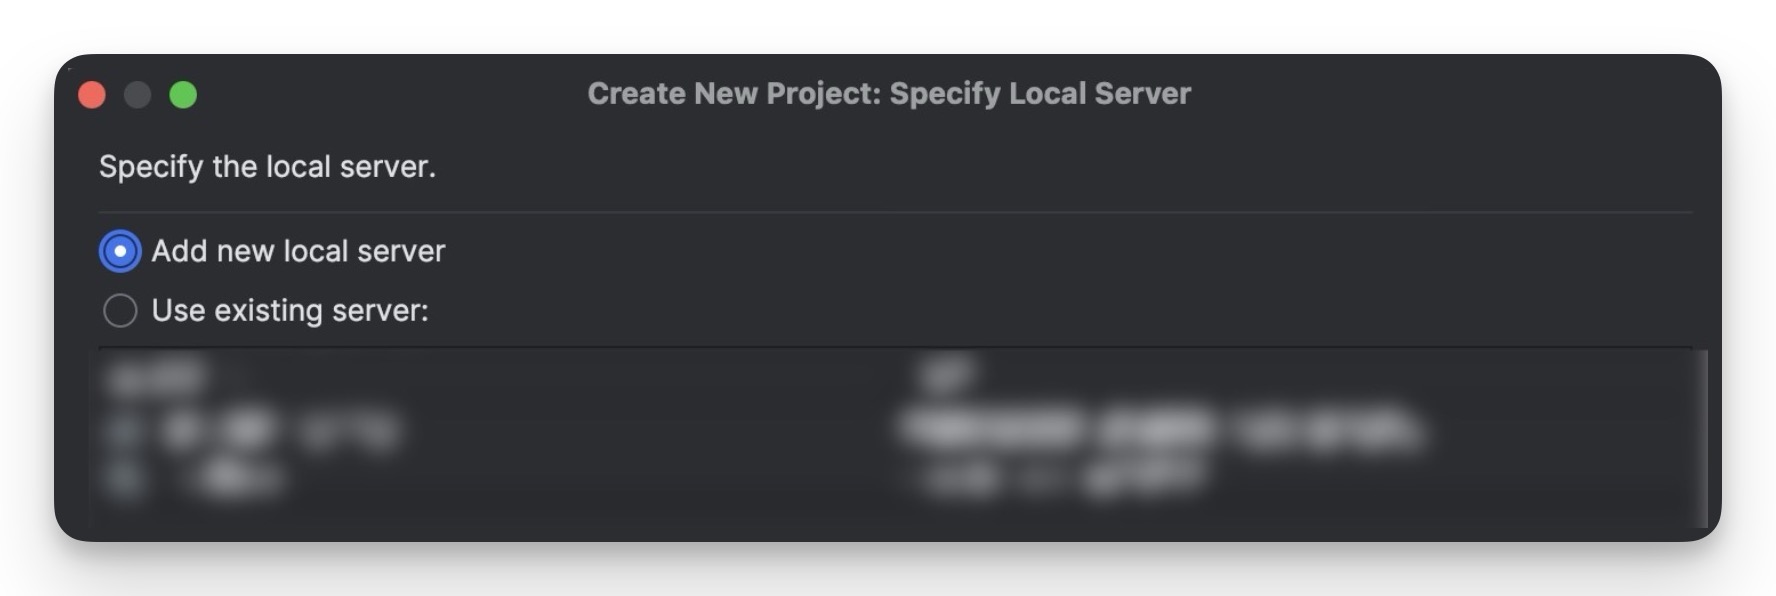
and specify the local server it will later listen from:
(for my instance I am using a MAMP as my localhost server, and its port is manually set to 8889)

In case your project is hosted along with a bunch of other projects (for instance you have site-1, site-2, …, site-3, drupal 10 all hosted under the localhost), you will also need to set the web path:

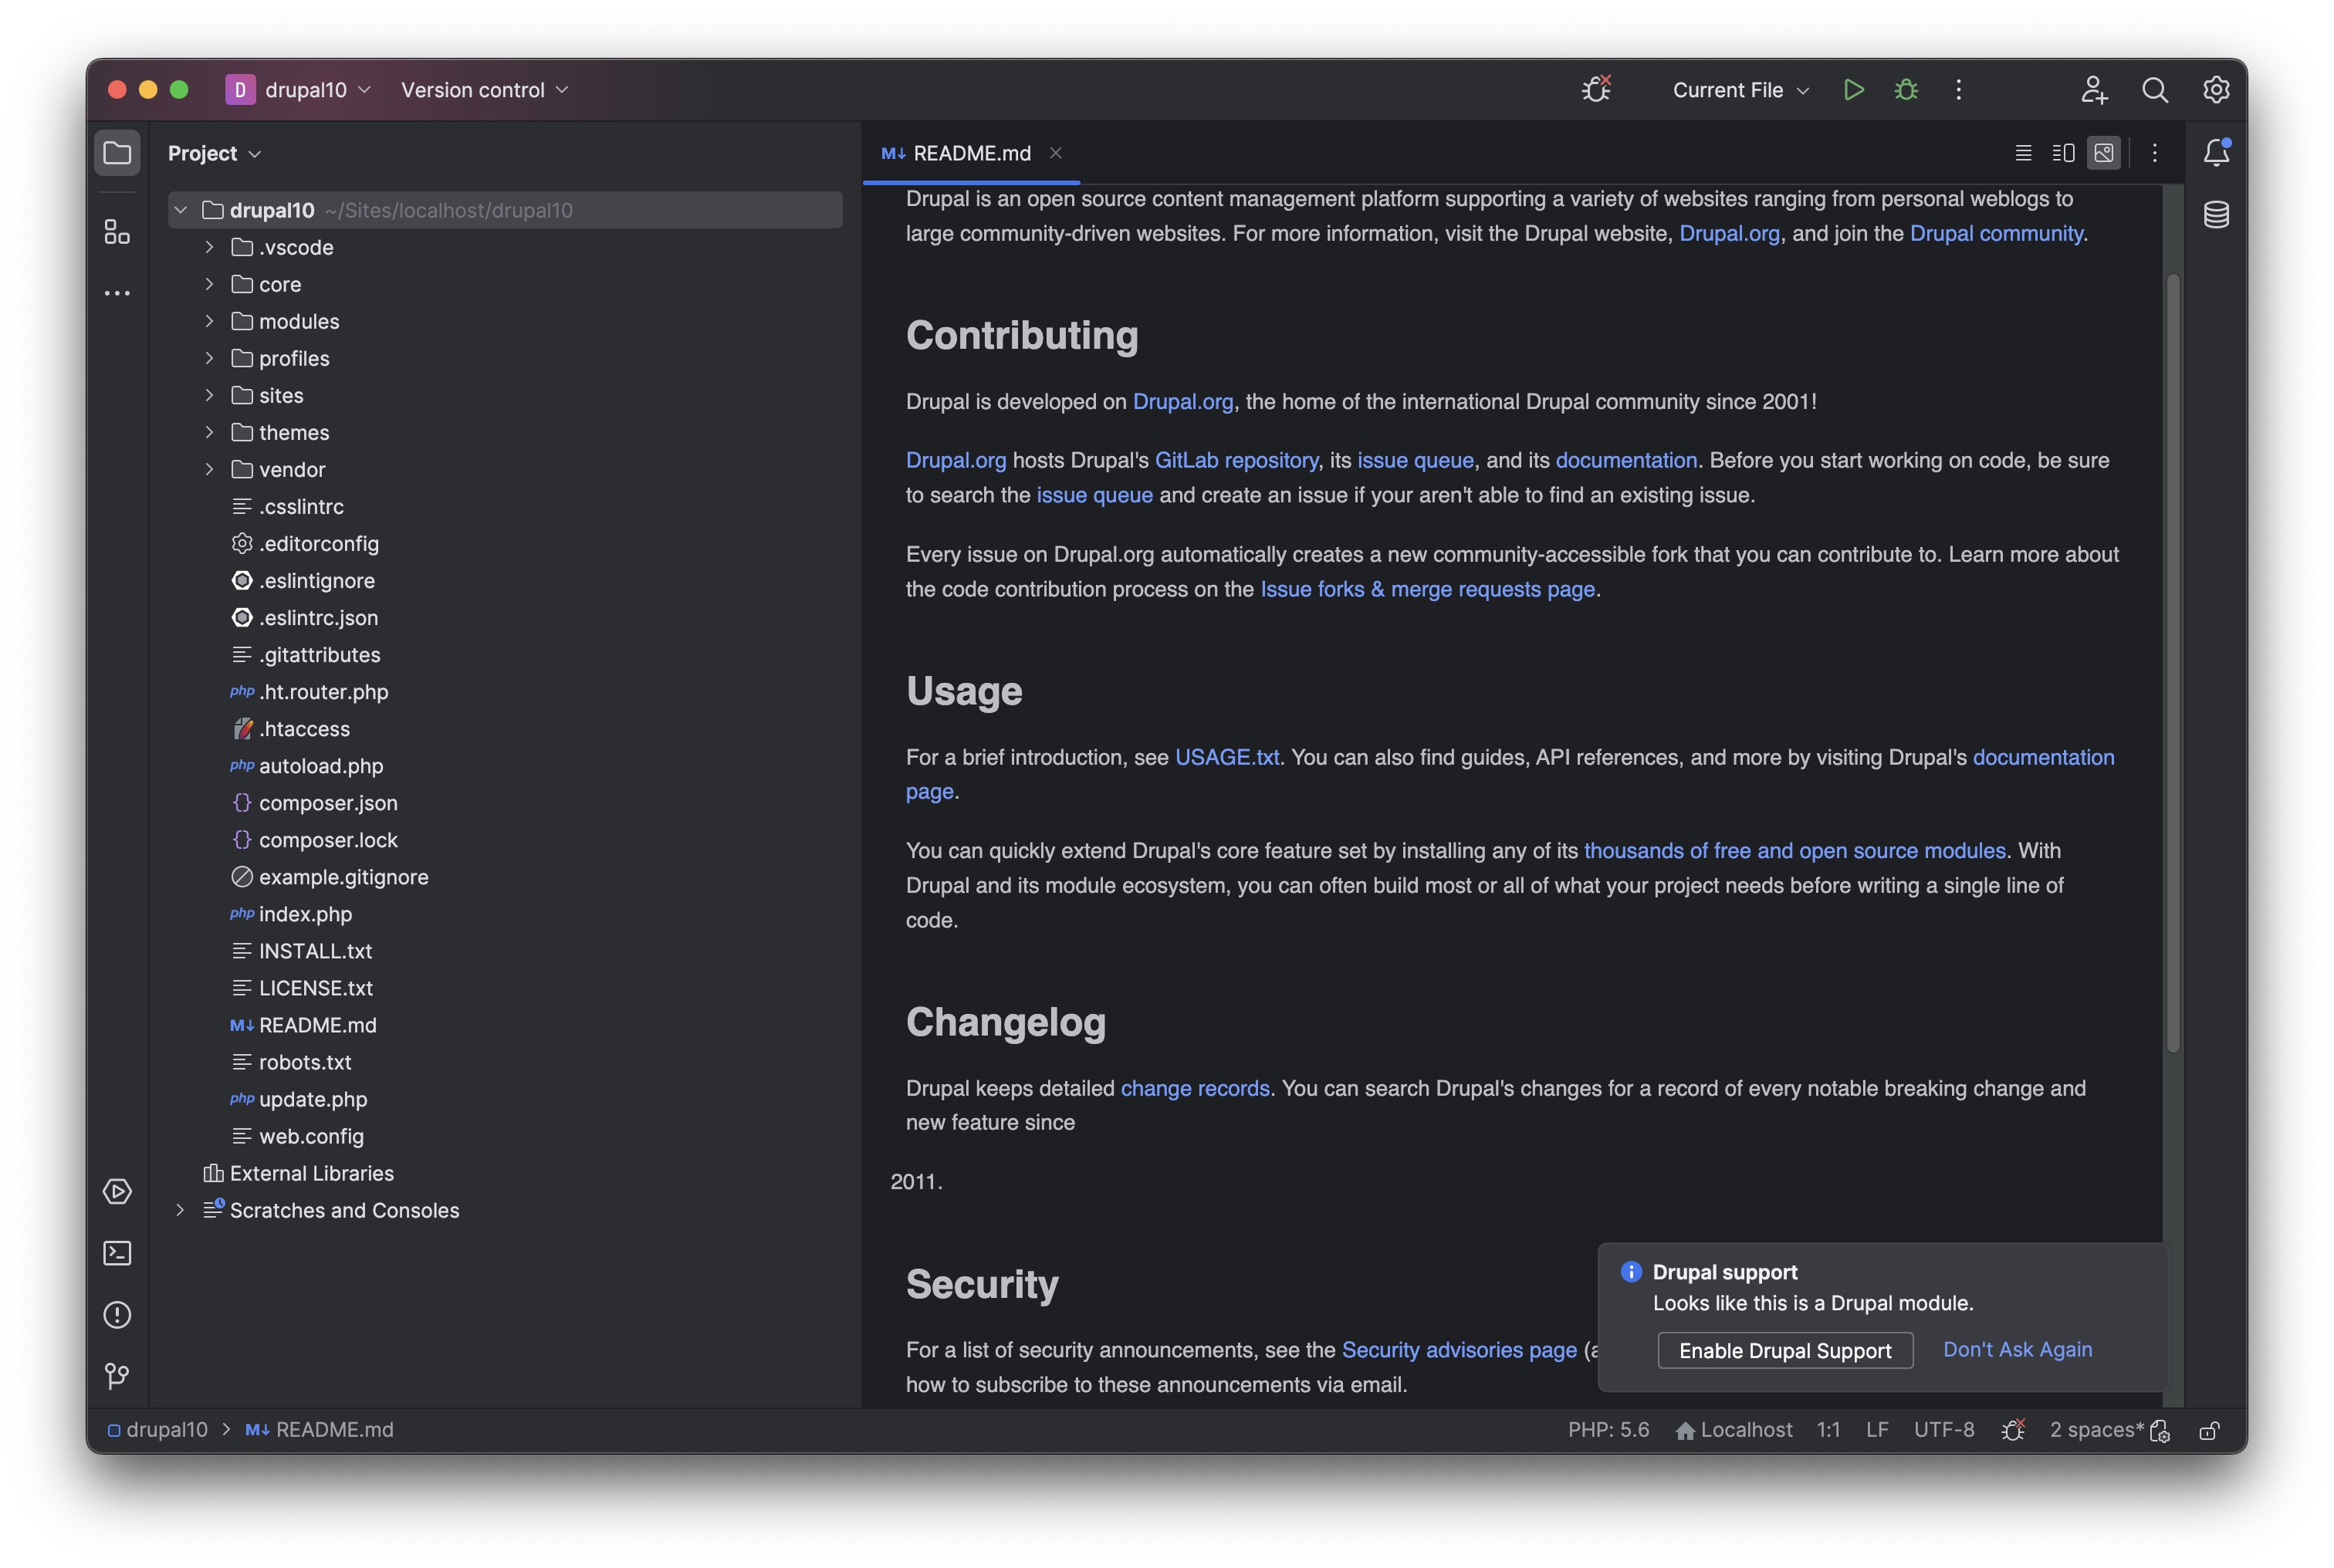
Once done you should see the PhpStorm editor, something like this:
Debugger/Listening and Breakpoint
Now we will setp the PhpStorm to listen on the server, and set breakpoints to debug a php file.
To start debugging, toggle on “Listening for PHP Debug Connections”, you can do that either via the PhpStorm’s menu: “Run > Start Listening for PHP Debug Connections” or via the little “bug icon” located on the top right of the panel:
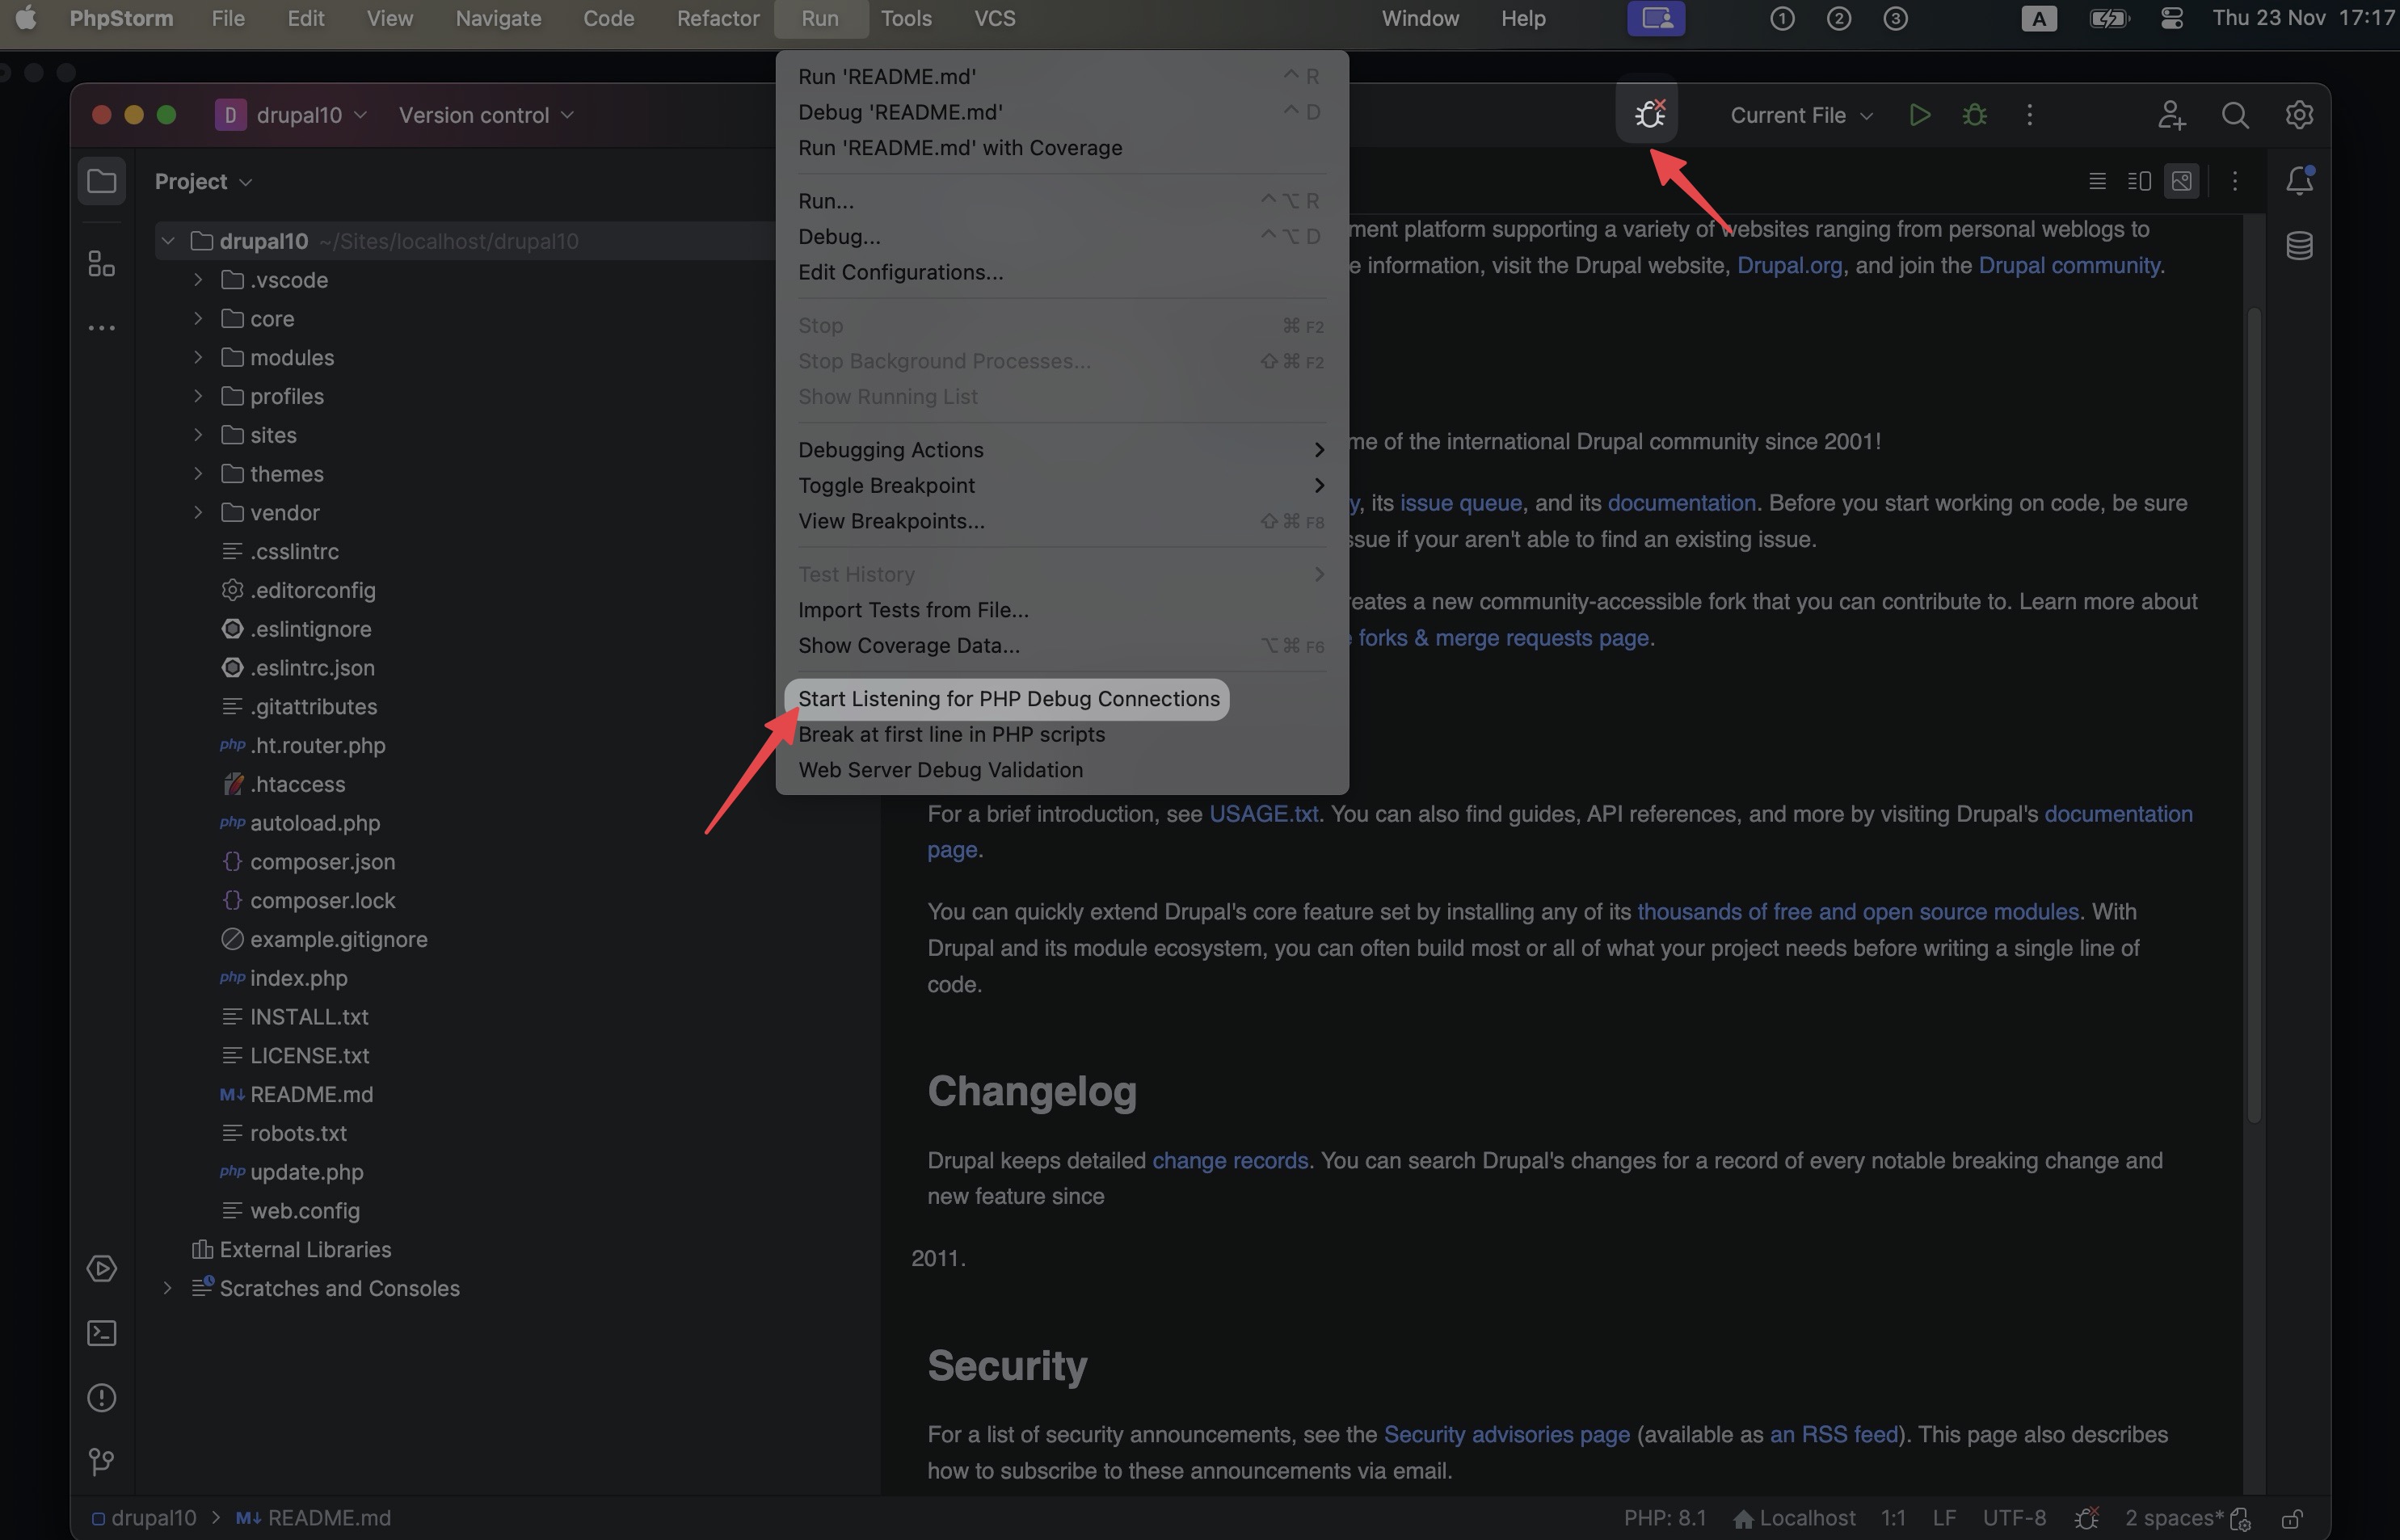
Now lets add “break point” at the entry point for every drupal site index.php (by clicking on the left of the line-number), reload the page, and you will see something like the follow screenshot; You will see a pop-up window “Incoming Connection From debug”, select the root folder that you are concerned with, and click “save”.
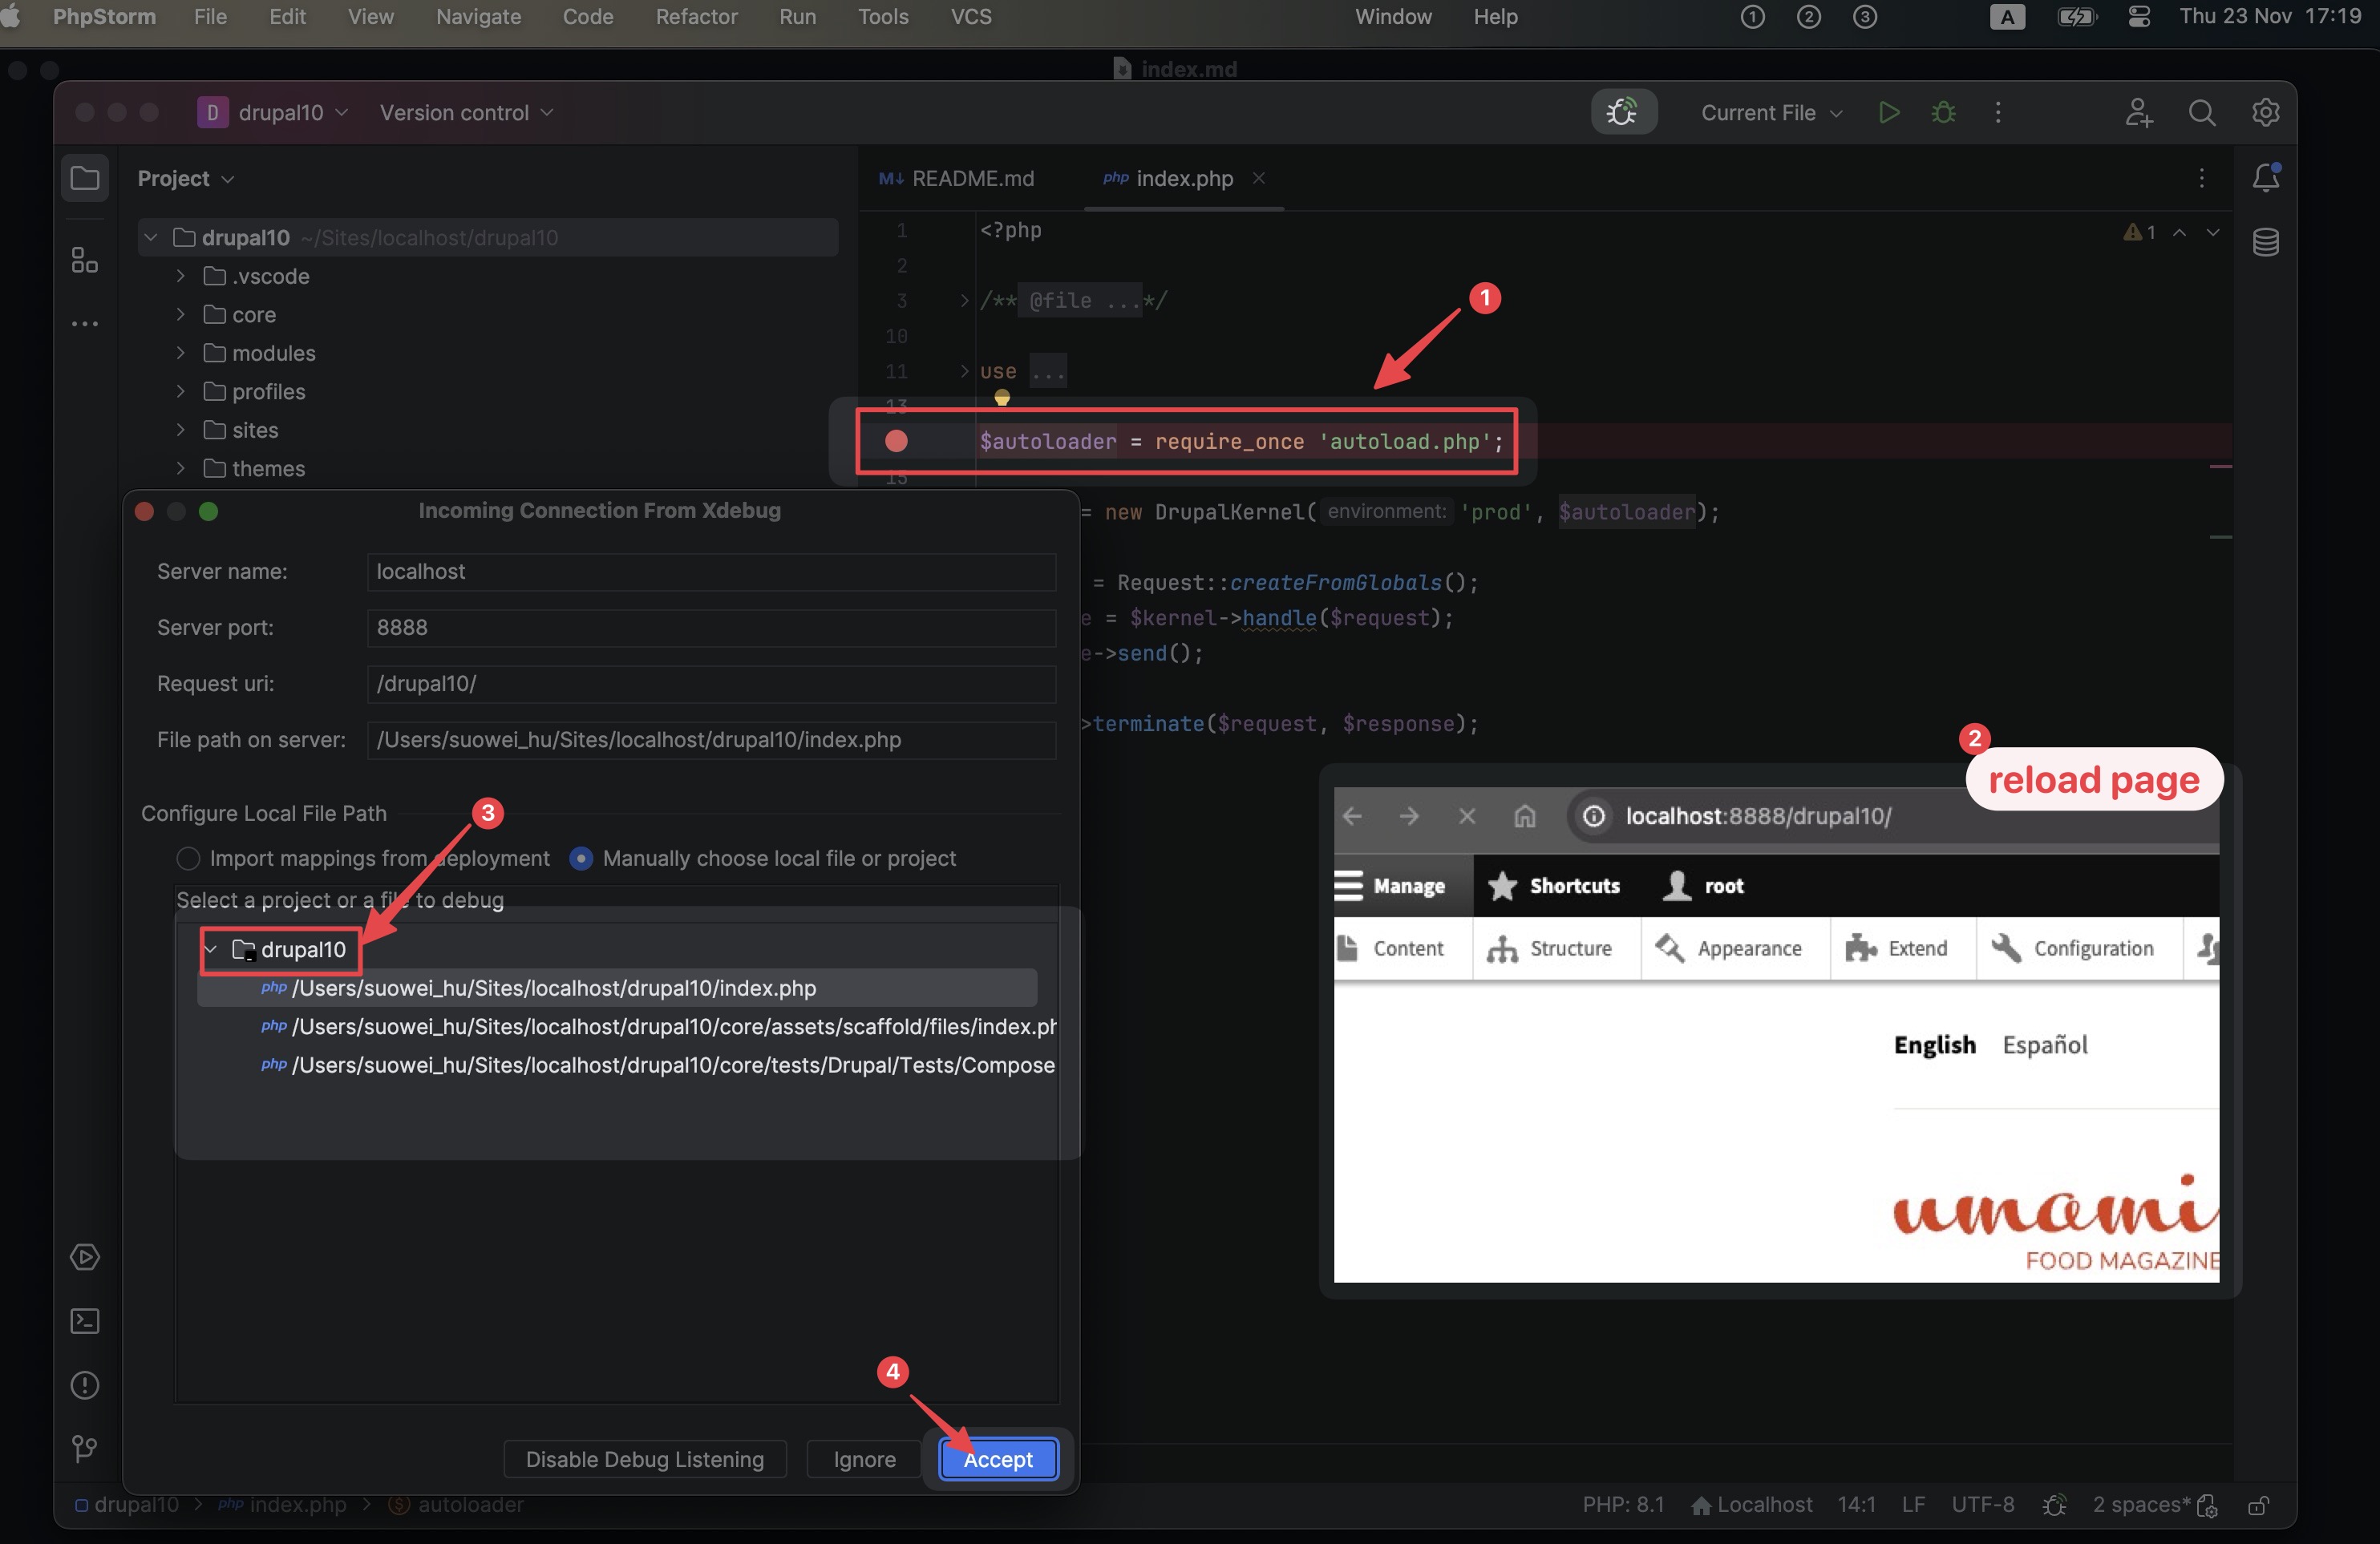
Once clicked “save” you should be seeing the “debug console” panel opens, which you can see the variables of the current scope, error message, console output, etc…
