WebProfiler adds a toolbar at the bottom of every page and shows you various stats, such as the number of database queries loaded on the page, which services are used, and more.
Active Toolbar Items
By default, WebProfiler comes with a toolbar with clickable buttons to reveal some extra information about the website that’s currently running, and its configuration panel you have a lot of other additional toolbar items you can enable, that will greatly improve your developer experience.
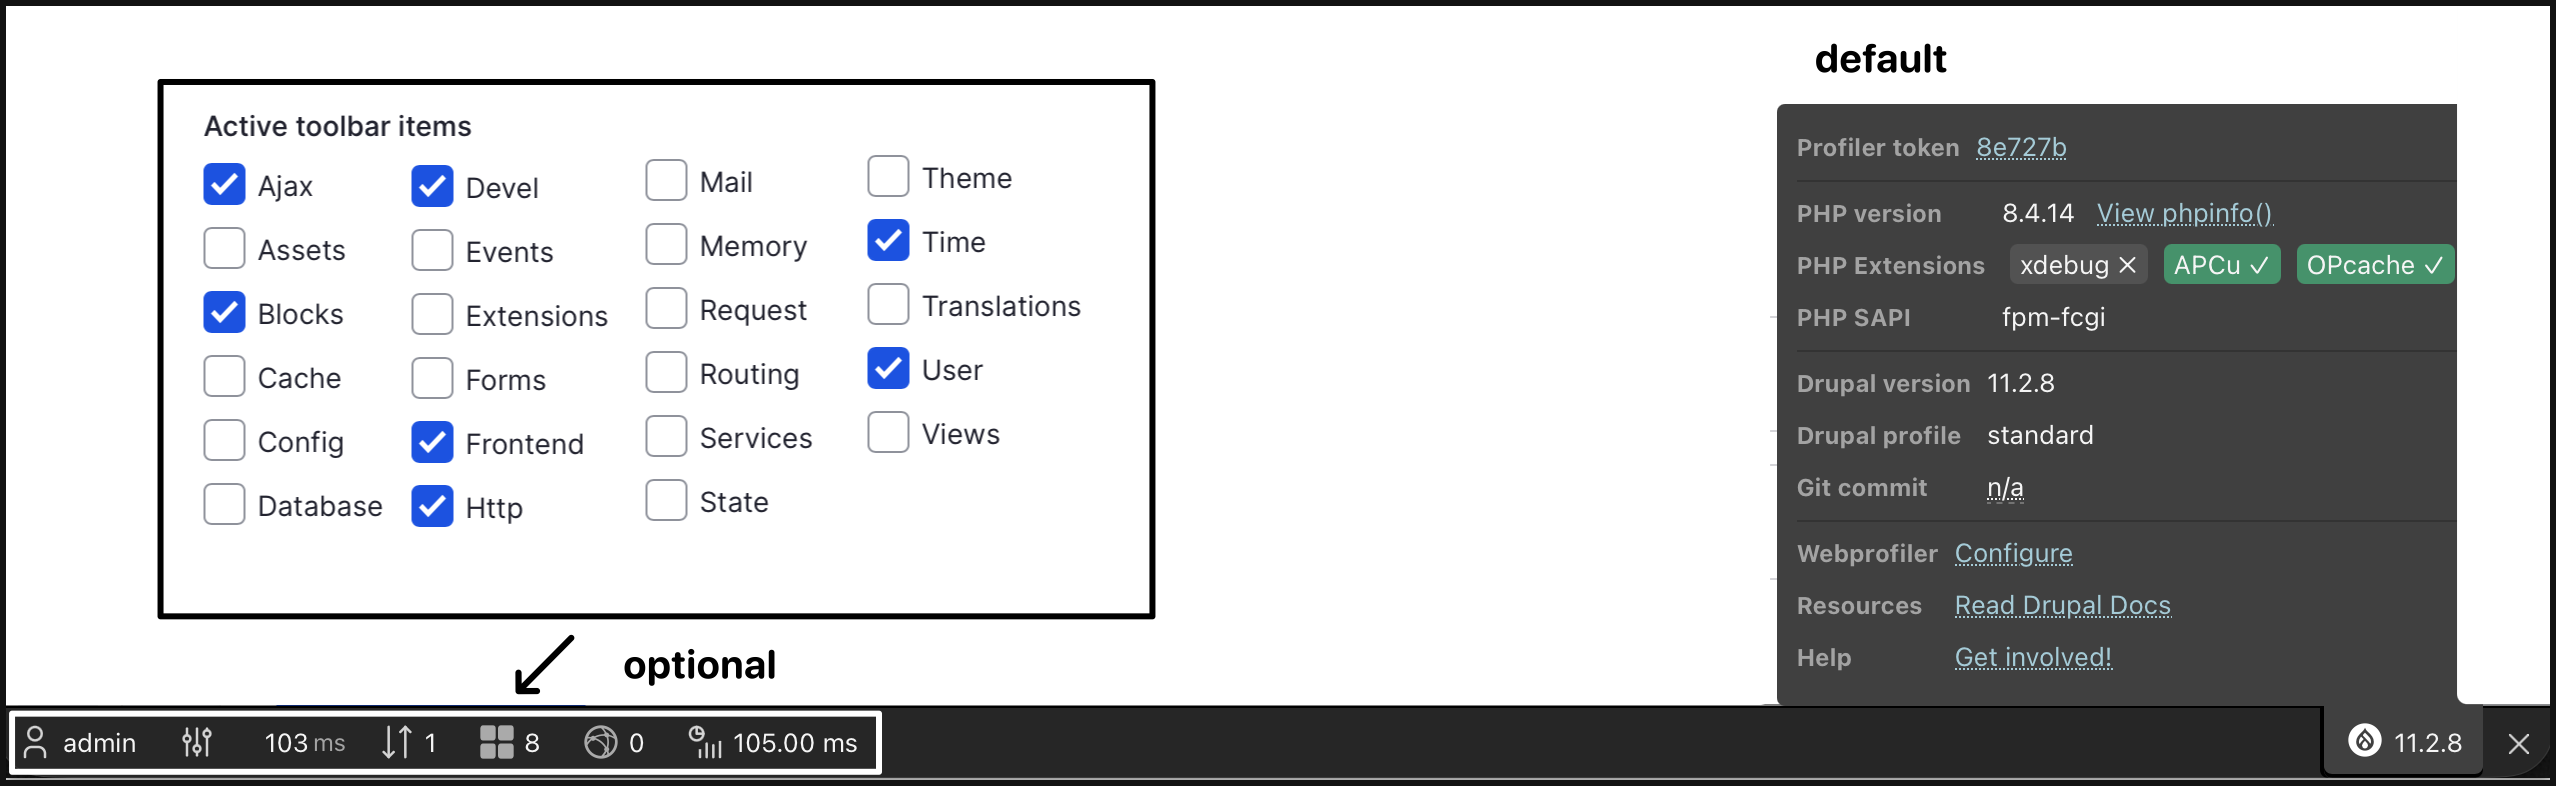
Below are the whole list of available “toolbar items” provided by the WebProfiler module:
Ajax
- lists Ajax requests with URL, status and time
- links into full profiles for each call
- see: screenshot
Assets
- shows all CSS/JS assets
- click to reveal origins and aggregation
- helps spot duplicates or missing libraries
- see: screenshot
Blocks
- lists rendered blocks, regions, providers and timings (sometimes you may need to turn off the caching for this toolbar item to show all the blocks)
- useful for visibility and performance issues
- see: screenshot
Cache
- summarises cache hits, misses and operations per bin
- exposes poor caching or heavy invalidations.
- see: screenshot
Config
- exposes configuration website / objects used
- helps trace settings and environment-specific overrides.
- see: screenshot
Database
- show default database
- lists all queries with SQL, time/duration and stack
- see: screenshot
Devel
- integrates Devel tools and dumps
- central place to inspect debug output.
- see: screenshot
Events
- PENDING INVESTIGATION
Extensions
- lists enabled/disabled modules and themes with versions
- show the path of the file (if you worked with some old drupal project, you’ll know some project are installed manually via copy/pasting the project files, and they can be anywhere within the modules folder)
- see: screenshot
Forms
- inspects forms, handlers, submitted values and errors
- great for debugging form submissions
- see: screenshot
Frontend
- collects browser performance timings
- compares backend time with real page load experience
- see: screenshot
HTTP
- PENDING INVESTIGATION
Mail
- PENDING INVESTIGATION
Memory
- show memory usage
- see: screenshot
Request
- high-level summary: route, controller, method, status, timing and panel links.
- see: screenshot
Routing
- Shows available routes and the matched one; includes parameters, defaults and requirements.
- see: screenshot
Services
- PENDING INVESTIGATION
- see: screenshot
State
- PENDING INVESTIGATION
- see: screenshot
Theme
- shows active theme, template suggestions
- twig templates with timings
- see: screenshot
Time
- show “Total time”, and “Initialization time”
- (by default, the time metrics will not be collected, to enable this please see guide: link)
- see: screenshot
Translations
- PENDING INVESTIGATION
User
- shows current user, roles and auth context
- handy for permission debugging (when working with devel’s “quick change user” feature)
- see: screenshot
Views
- profiles views executed: displays, query count, execution time …
- you can jump to the view directly from the profile collector
- see: screenshot
IDE Settings
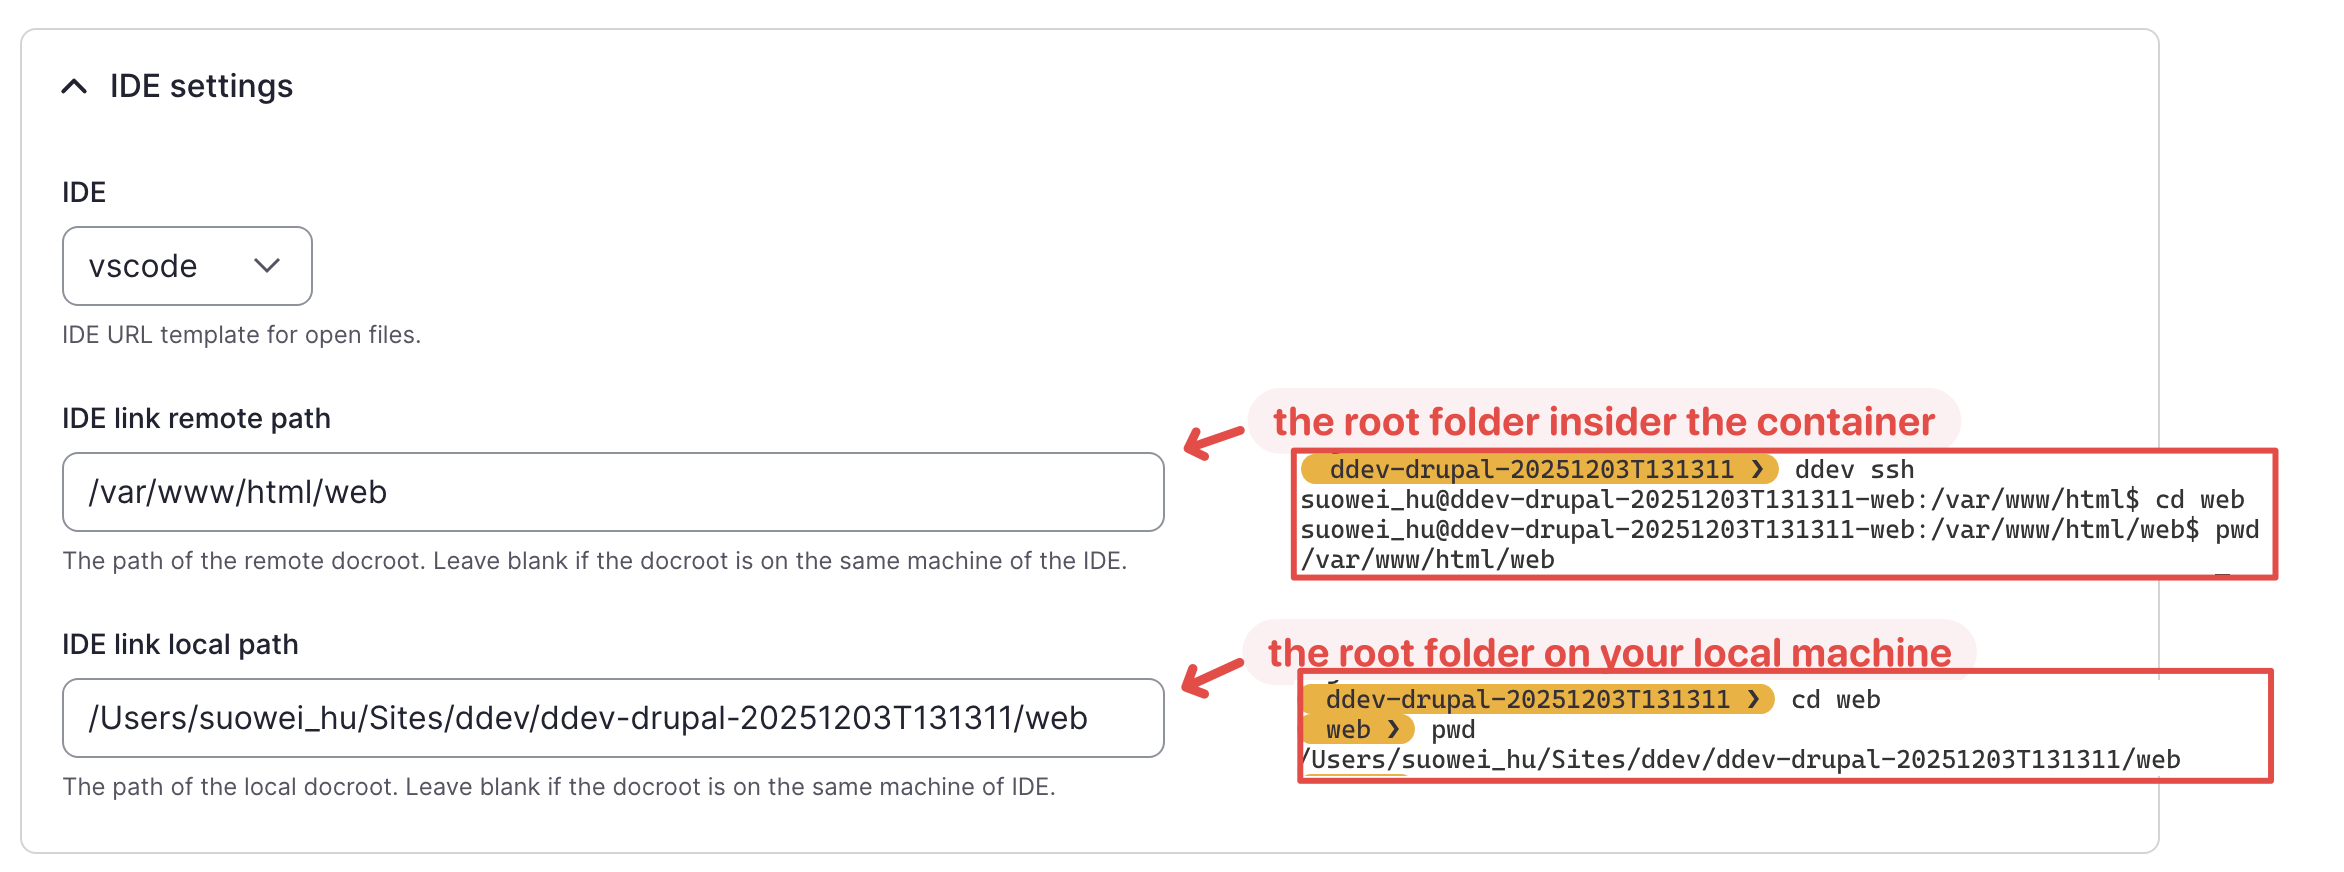
WebProfiler works by wrapping elements such as controller classes, event subscribers, and template paths in links that use a custom URL scheme (for example, vscode://). When you click one of these links, your operating system passes it to your IDE, which then opens the corresponding file at the specified line.
WebProfiler Configuration > IDE Settings:
- IDE / IDE link: URL template used to open files at a line in your editor.
- IDE link remote path: Where Drupal’s docroot lives from PHP’s point of view (container/remote), if you are using DDEV this will be either
/var/www/htmlor/var/www/html/web. - IDE link local path: Where the same docroot lives on your local machine (where your IDE runs), if you are on a mac, you can select the root folder in Finder and press
⌘ + ⌥ + Cto copy its absolute path.
After setting up the IDE settings, you can quickly jump between the parts of the website and your source code. For instance: opening the Controller (e.g. ViewPageController.php) of front page from the bottom toolbar, opening the line where error is thrown from the error page provided by web profiler:
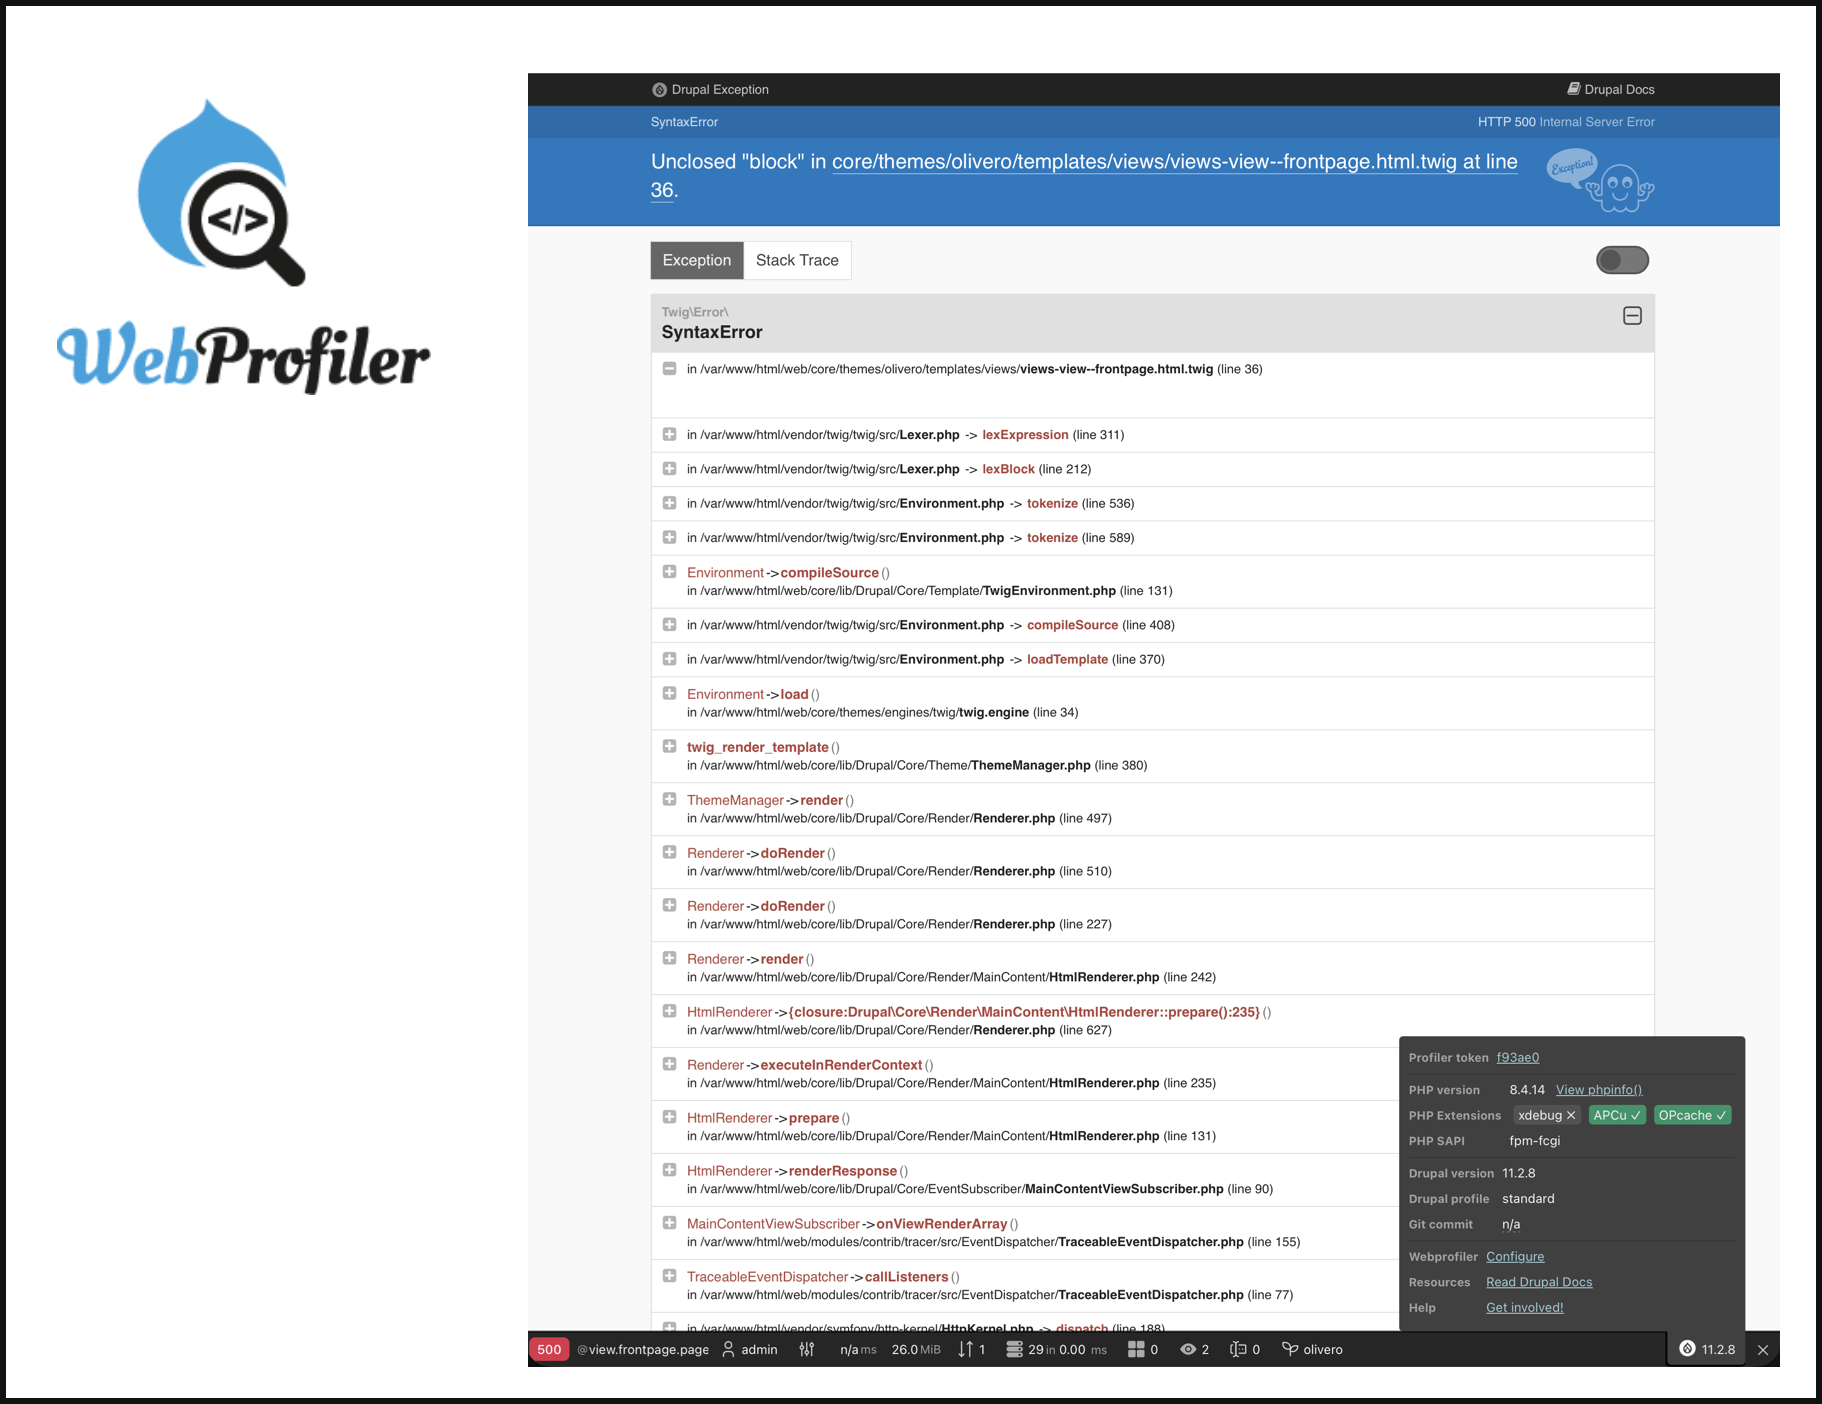
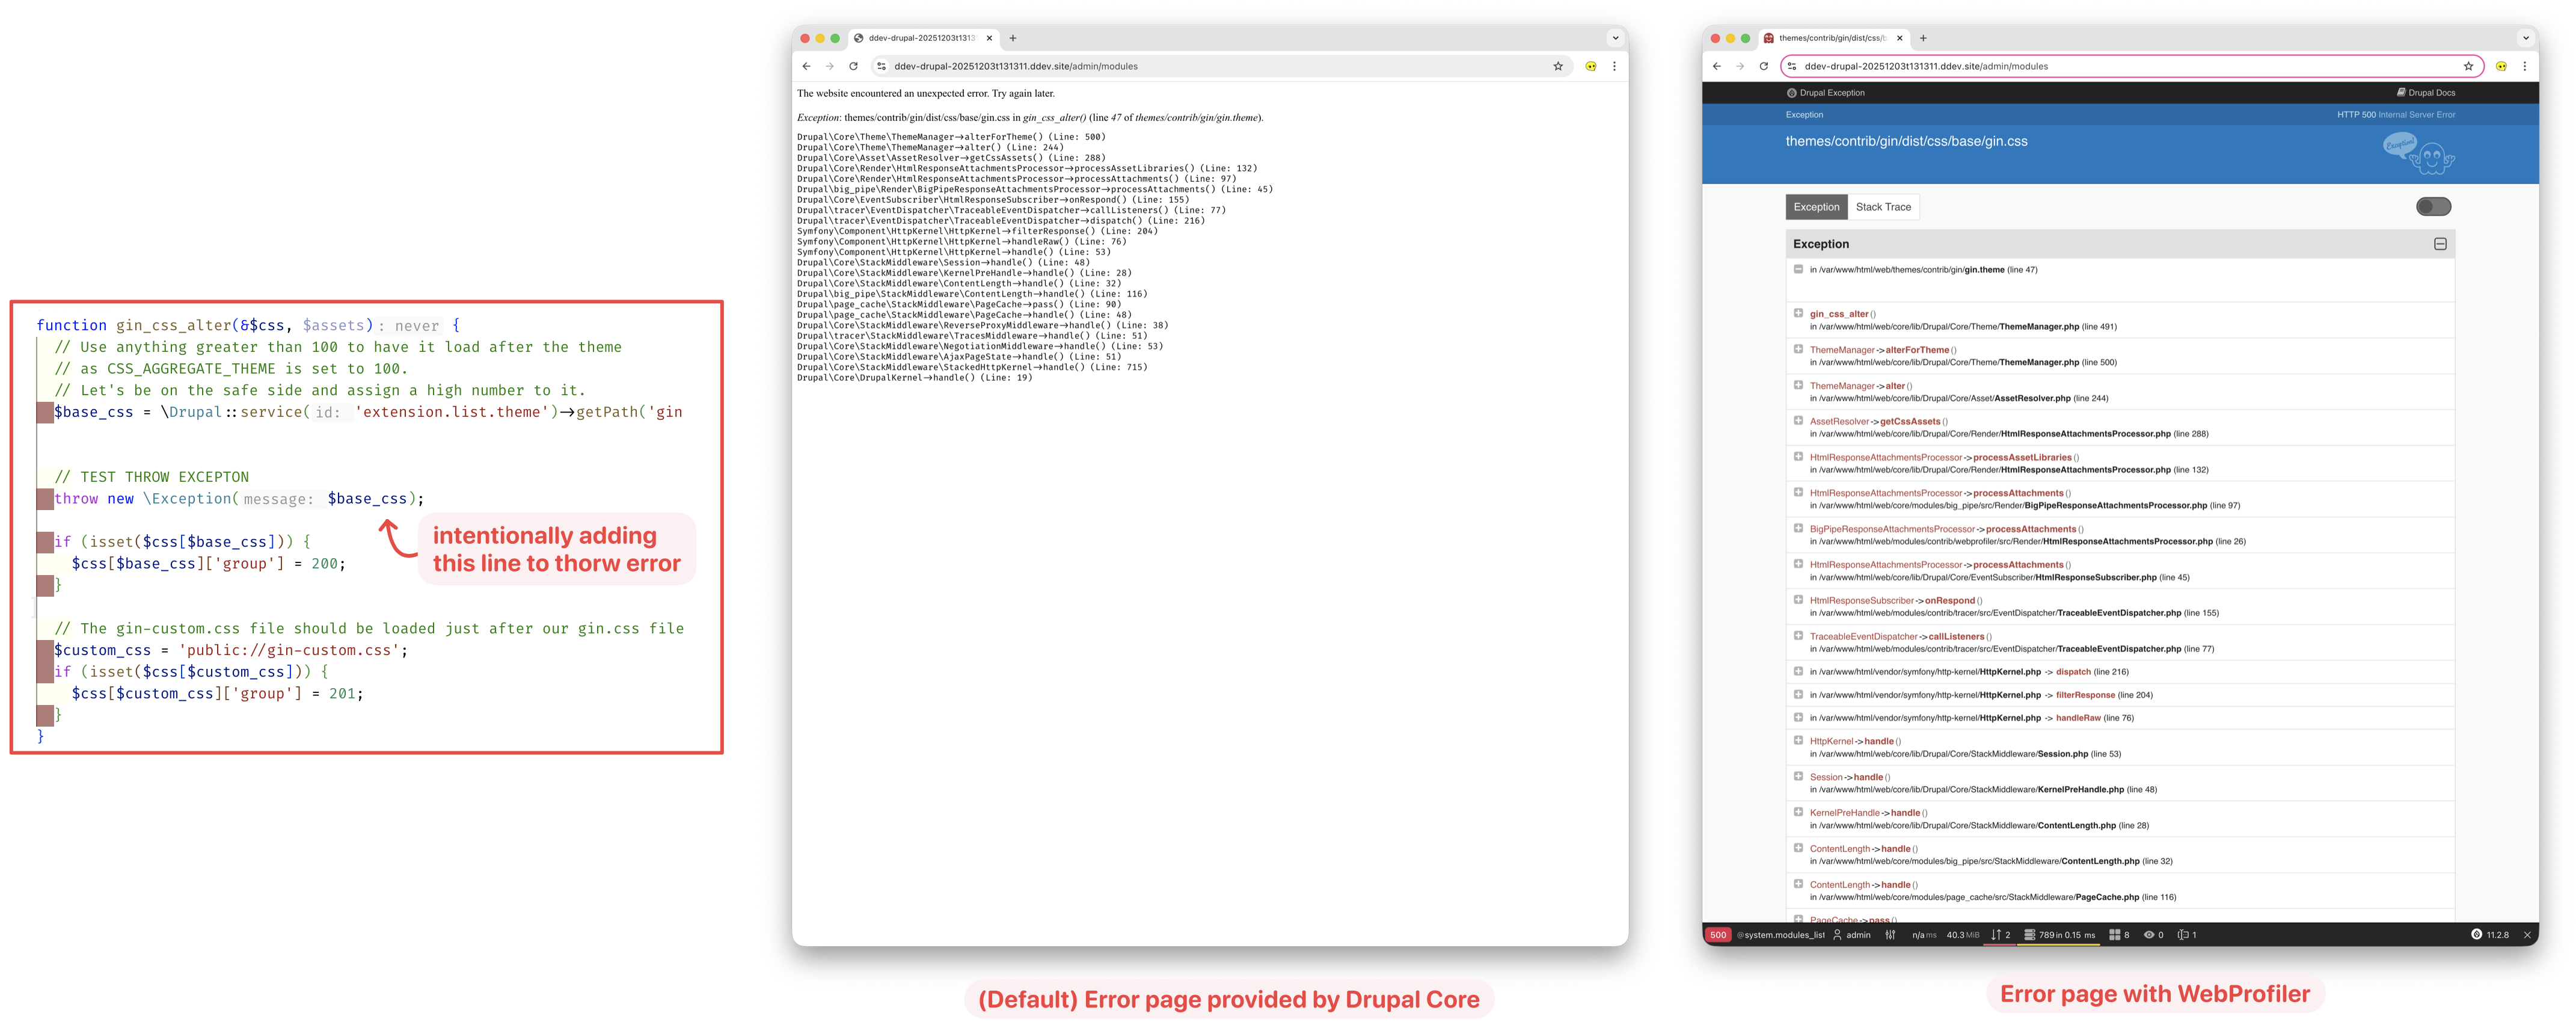
Enhanced Error Page
WebProfiler basically replaces Drupal’s boring and un-styled “The website encountered an unexpected error” with a Symfony-style debug page that’s actually useful. It adds the following:
- Rich exception page: When a PHP or Twig exception happens, you get a full debug page instead of the generic Drupal error. It shows: exception message, code excerpt, full stack trace.
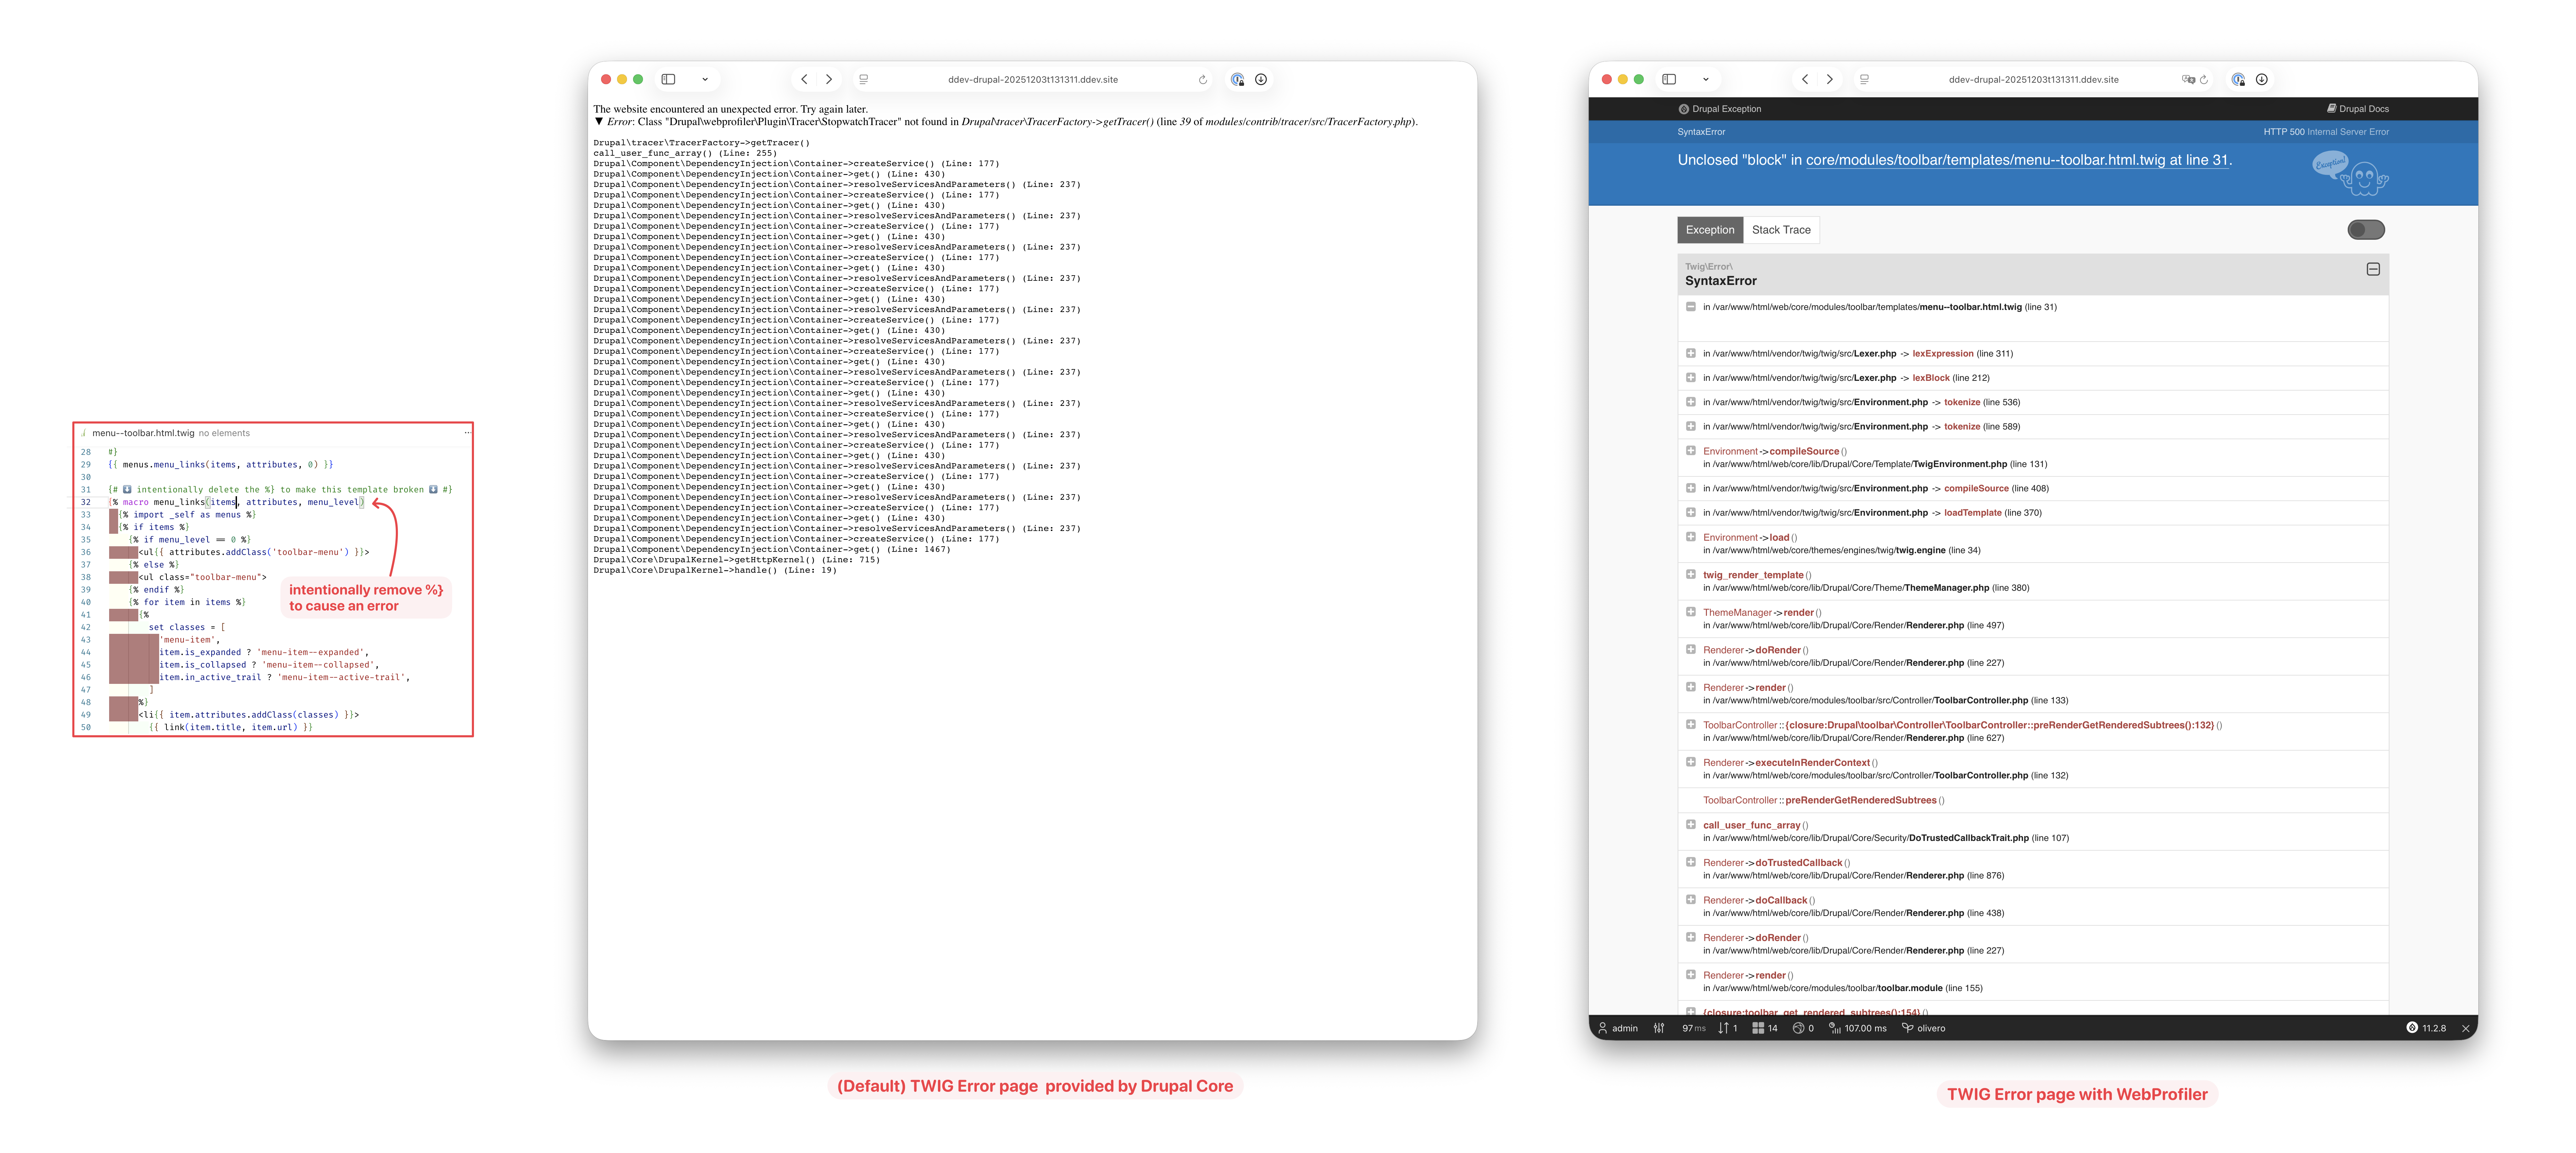
- Works for Twig Template: Twig template errors get the same treatment: highlighted Twig source + trace, not just a vague “template error” message.
- Clickable link into your IDE: after setting up the IDE setting, you can click on the files to jump to the source code file using your preferred editor.
- Profiler toolbar on the error page: Even when the request blows up, the WebProfiler toolbar still appears at the bottom of the error page, so you can open the full profile for that failed request: database queries, events, forms, cache, timeline, etc.
- Can be turned off if you prefer native one: via
$settings['webprofiler_error_page_disabled'] = TRUE;Reference: post by WebWash & SparkFabrik
EXAMPLE PHP ERROR
EXAMPLE TWIG ERROR
Using WebProfiler “Config” Panel to Set Configuration ?
(Using WebProfiler Config to find Drush Command to Set Config) Upon installing the WebProfiler module and enable the “config” panel through its configuration page, you can find the configuration of core/modules/theme easily.
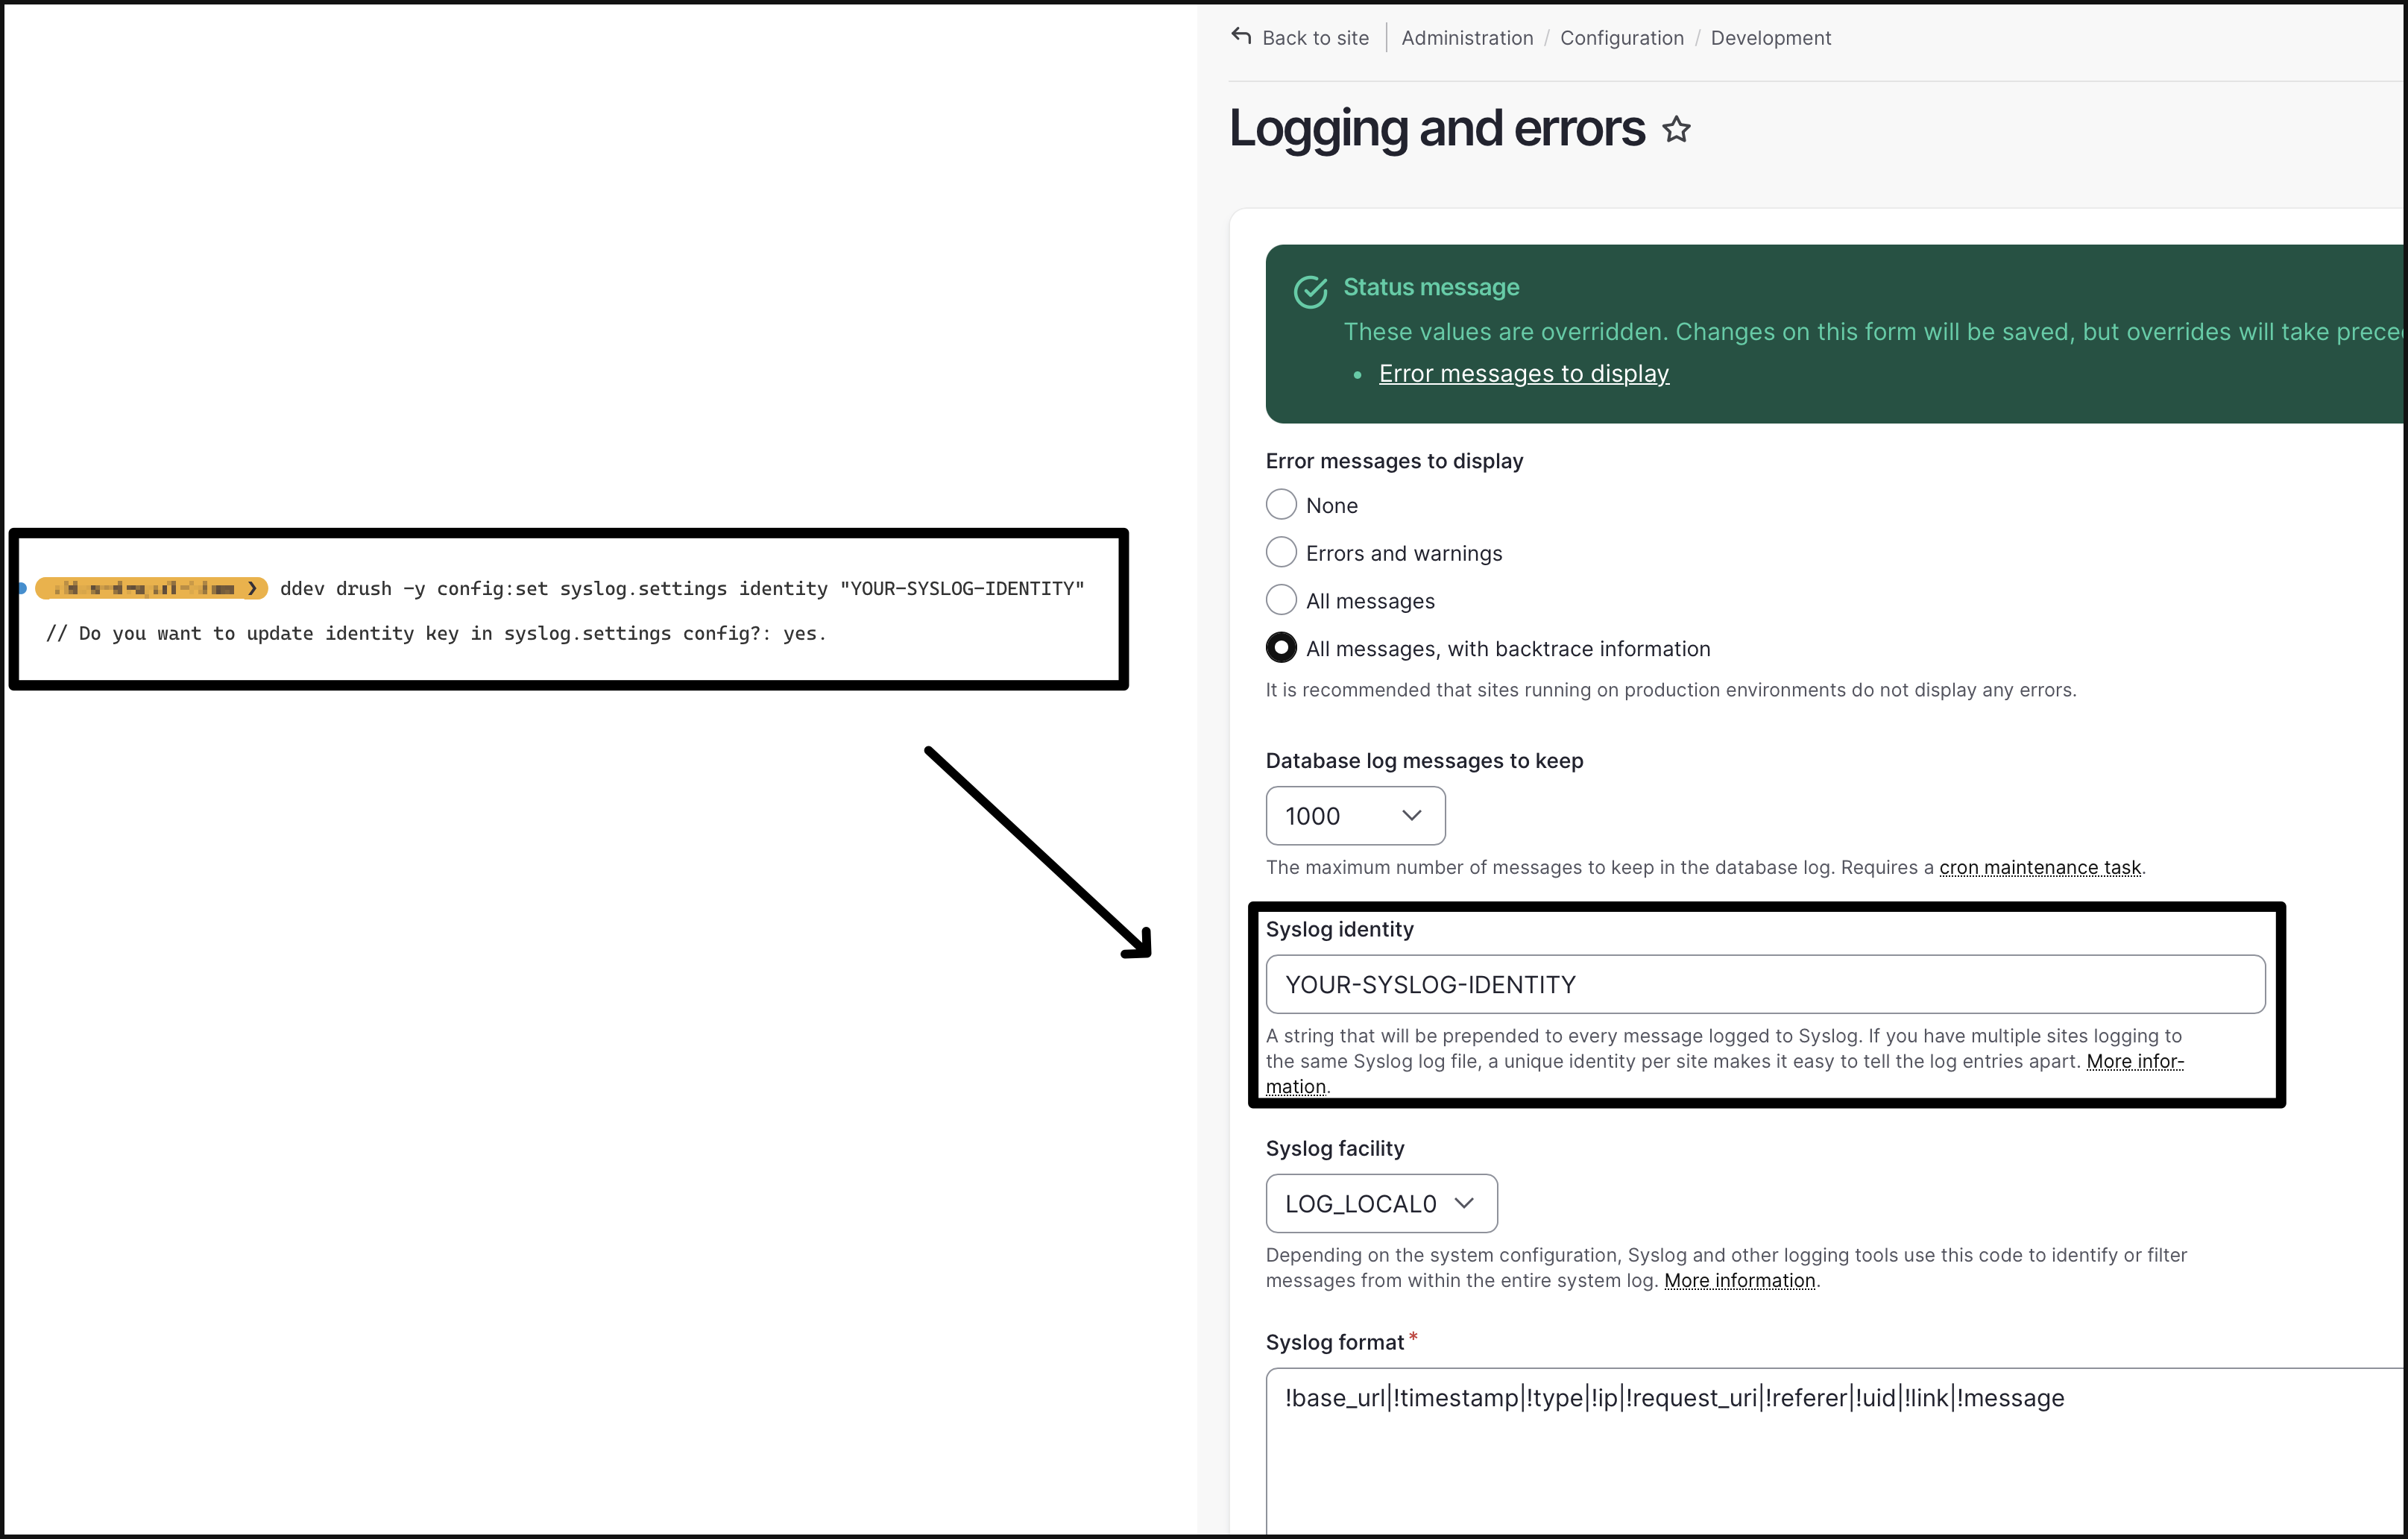
Example1: Syslog
For instance, to find command to set configuration for syslog module:
through WebProfiler we can identify that syslog.settings have:
| |
Hence we can use the drush config:set command to set its identity (Syslog identity) for example:
Example2: Aggregated HTML/CSS
| |
Common Error / Resolution
If you do not remove the following line from your site/default/settings.php file after uninstalling WebProfiler or Tracer module:
$settings['tracer_plugin'] = \Drupal\webprofiler\Plugin\Tracer\StopwatchTracer::class;
You will see this error when running any drush command:
[error] Error: Class "Drupal\webprofiler\Plugin\Tracer\StopwatchTracer" not found in Drupal\tracer\TracerFactory->getTracer() (line 39 of /var/www/html/web/modules/contrib/tracer/src/TracerFactory.php) #0 /var/www/html/web/modules/contrib/tracer/src/EventDispatcher/TraceableEventDispatcher.php(266): Drupal\tracer\TracerFactory->getTracer()
Resolution is simple, just comment out the line !
Reference
- Contributed Module / Project Page
- Blog Post / Video about this Module / Project: