*p.s. please utilise PHP version 8.2.13 or earlier, as XDebug compatibility issues have been identified (on my end) with PHP ≥8.3.0 versions at the time of writing.
1 - Configurae MAMP
To begin with you will need to configure your php.ini file, here different resource I found online claims that you should edit at different localtion, for your reference, the version that worked for me is to edit it directly in MAMP’s PHP Configuration Panel clicking on the Open Template… button will take me to the edit panel of php.ini file for the current running instance of the php.
(In case it didn’t work for you, you may also try editing both /Applications/MAMP/conf/php[version]/php.ini and /Applications/MAMP/bin/php/php[version]/conf/php.ini)
For all of the php.ini file mentioned, you will need to add the following:
| |
2 - Configure VS Code
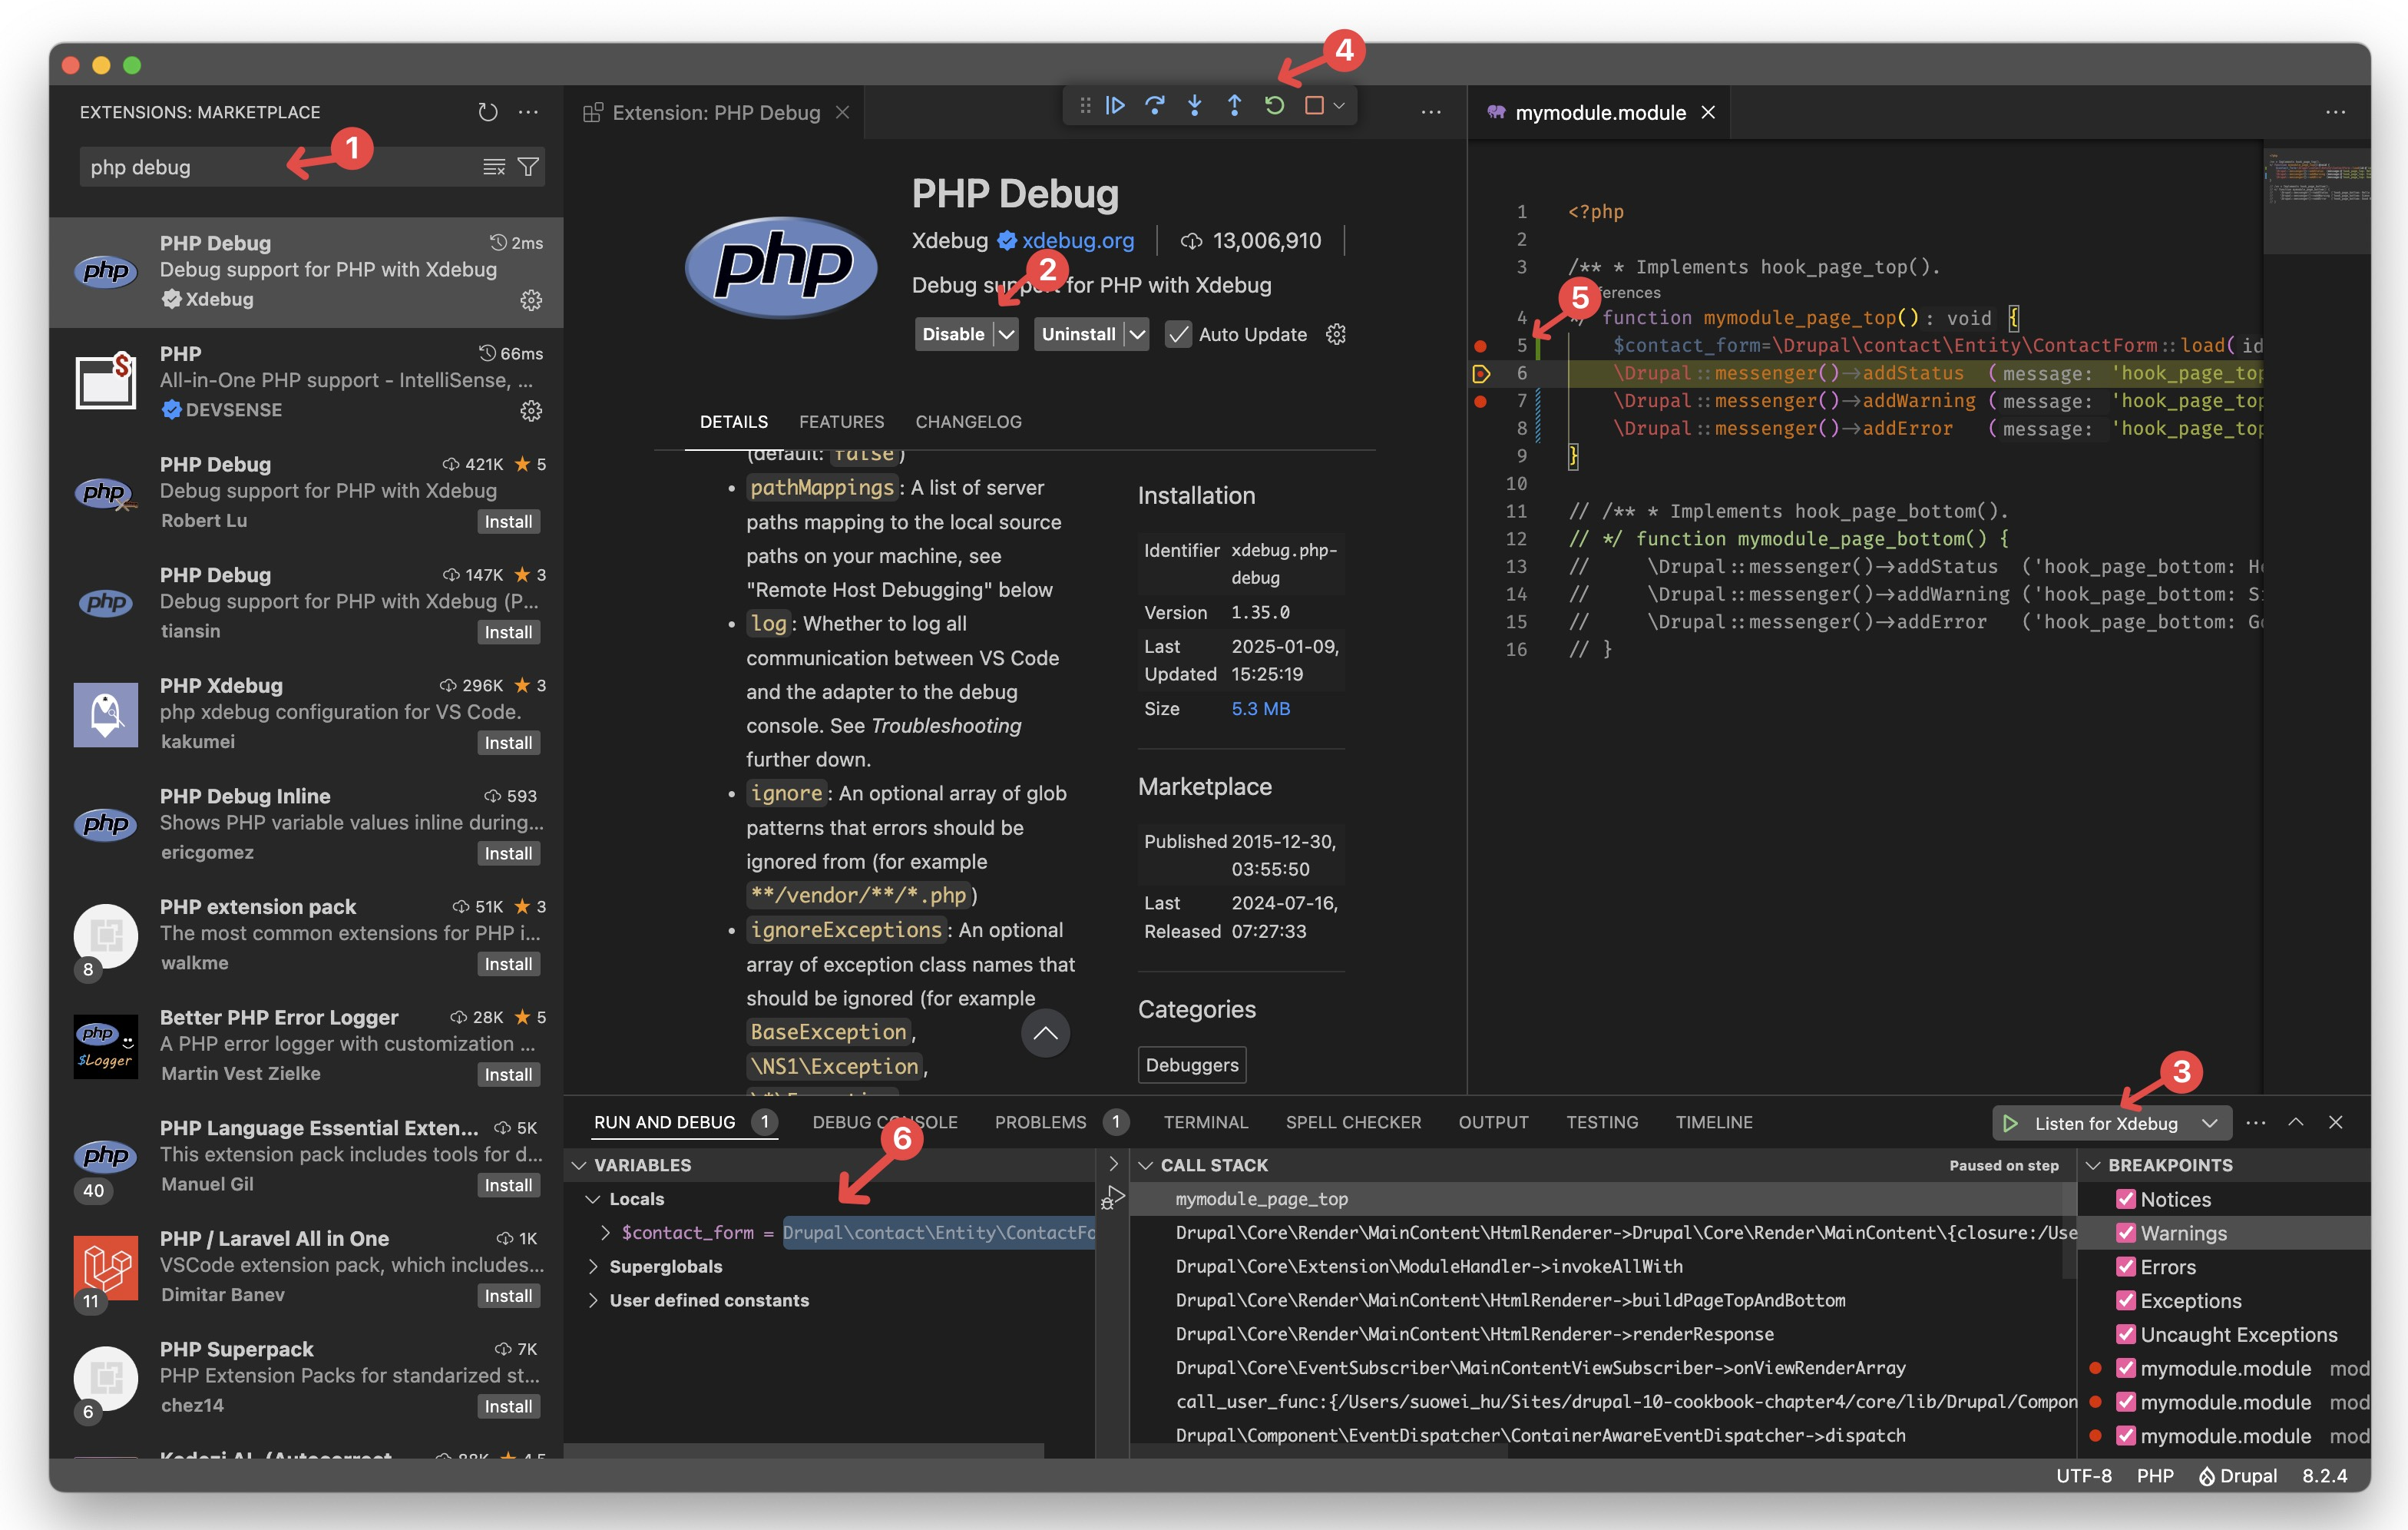
Method-1: by using php debug module to listen to xdebug ports

- Search for “PHP Debug“ in market place
- Install the “PHP Debug“ extension
- Run the “Listen for XDebug“ command (alternatively you can run it with VS Code command pallet as “Debug (PHP): Start Listening for debug“)
- You should see a debug popup toolbox
- Add some few breakpoint
- Visit the drupal page as normal, and if the page triggers the breakpoint it will pause and you will be able to see the details relating to the executing scope in the “Run adn Debug“ panel, including the stored varaible in the current stack.
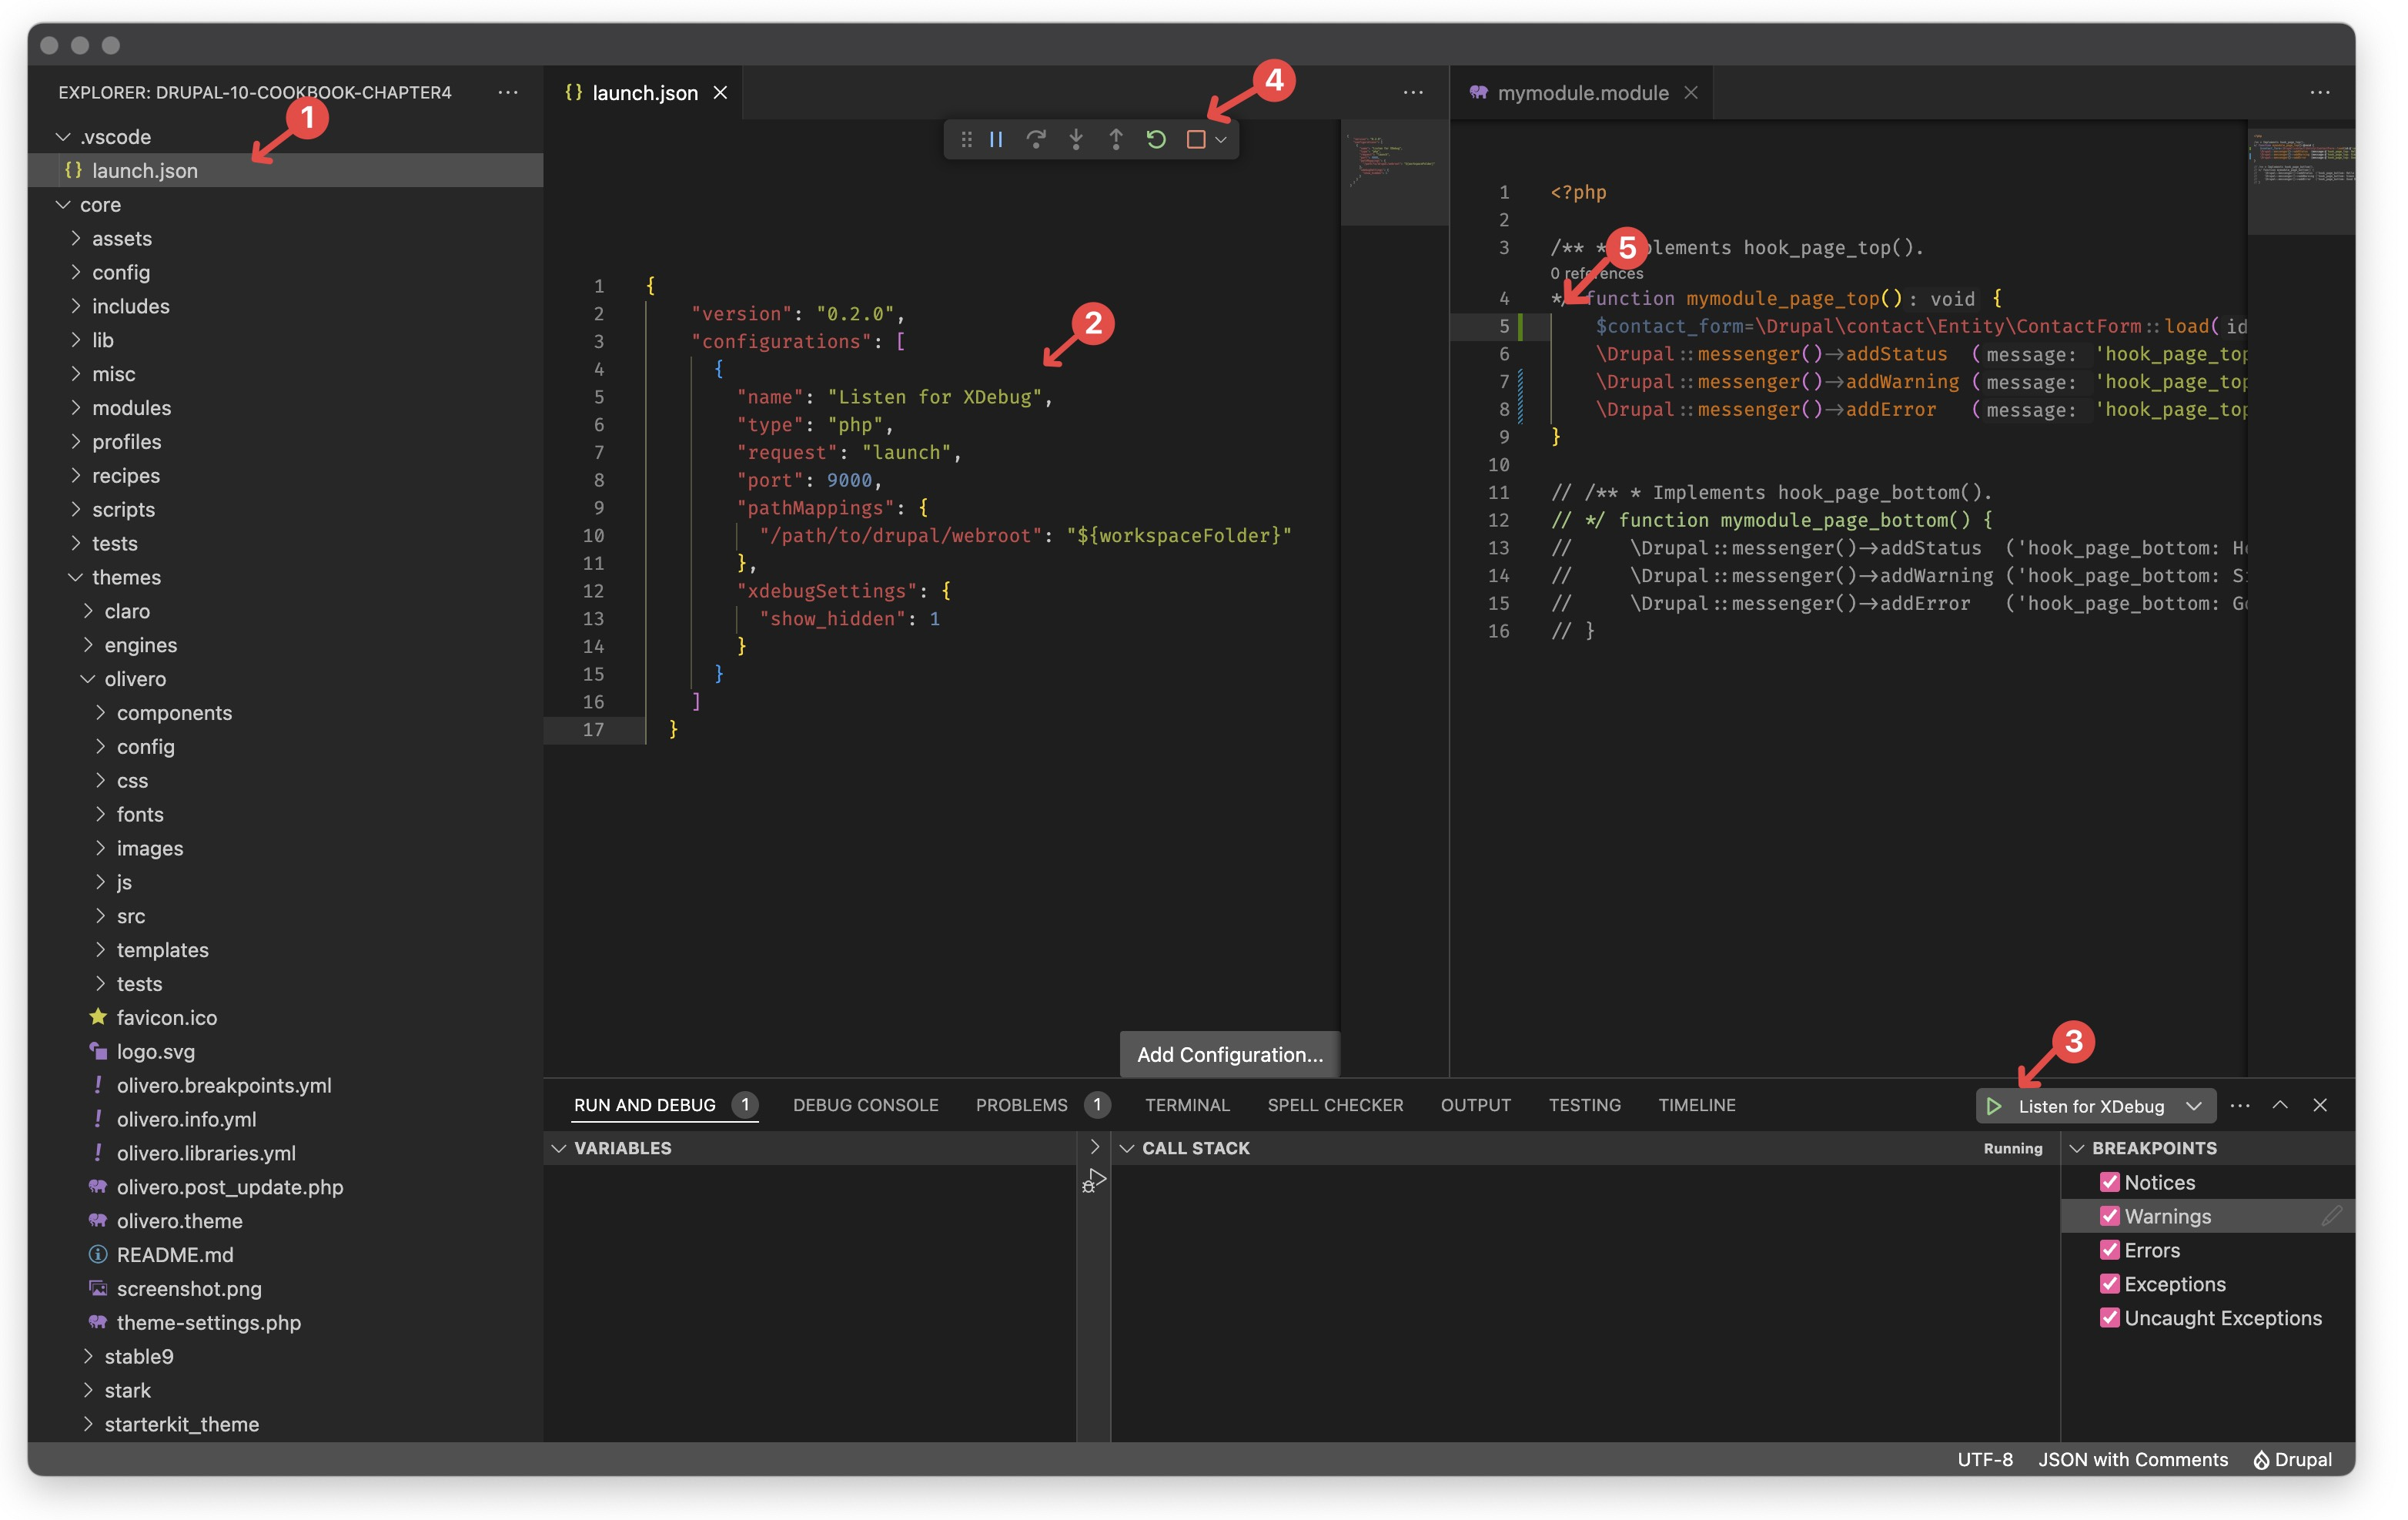
Method-2: create your launch.js and listen xdebug port
(only if the above method didn’t work for you)

- Create an empty
.vscodeif doesn’t exsit and an emptylaunch.jsfile in it - Enter your
Listen for XDebugphp command in the.vscode/launch.js - Go to the VS Code’s “Run and Debug” panel (usually located at the bottom), and run the command you just created
- You should see a debug popup tool box if the previous step successes
- Add debug breakpoint in your code, and trigger the debugger with the
?XDEBUG_SESSION_START=idekeytailing query parameter after your normal url.
3 - Start Debugging
For now since I haven’t used XDebug to debug my code a lot, I really don’t have much to say in this section, I’ll come back and revisit it if I have something to show-off (・ω・)b.
4 - Demonstrative Video
Reference
- Mac Enable Xdebug in MAMP: https://joshbuchea.com/mac-enable-xdebug-in-mamp/
- Xdebug debugger: https://www.drupal.org/docs/develop/development-tools/xdebug-debugger
- Xdebug debugger - VSCode: https://www.drupal.org/docs/develop/development-tools/configuring-visual-studio-code#s-configuring-xdebug
- PHP Debug Adapter for Visual Studio Code: https://marketplace.visualstudio.com/items?itemName=xdebug.php-debug