Quick Setup Guide
Install the VSCode Extension “PHP Debug”
Create a directory
.vscodefor upcoming configuration file to be placed inCreate custom task configuration file
.vscode/tasks.jsonfile and paste the following(Alternatively you may also turn xdebug on and off via running
ddev xdebug on/ddev xdebug off/ddev xdebug toggle, the reason we have it automatically on/off instead of leaving it always on is because of ites performance impact)1 2 3 4 5 6 7 8 9 10 11 12 13 14 15 16 17{ // See https://go.microsoft.com/fwlink/?LinkId=733558 // for the documentation about the tasks.json format "version": "2.0.0", "tasks": [ { "label": "DDEV: Enable Xdebug", "type": "shell", "command": "ddev xdebug on" }, { "label": "DDEV: Disable Xdebug", "type": "shell", "command": "ddev xdebug off" } ] }Create custom launch configuration file
.vscode/launch.jsonfile and paste the following(Notice that the XDebug mode for ddev will automatically be turned on/off by the launch commands)
1 2 3 4 5 6 7 8 9 10 11 12 13 14 15 16 17 18 19{ // See https://code.visualstudio.com/docs/editor/debugging#_launch-configurations // for the documentation about the launch.json format "version": "0.2.0", "configurations": [ { "name": "Listen for Xdebug", "type": "php", "request": "launch", "hostname": "0.0.0.0", "port": 9003, "pathMappings": { "/var/www/html": "${workspaceFolder}" }, "preLaunchTask": "DDEV: Enable Xdebug", "postDebugTask": "DDEV: Disable Xdebug" } ] }Start the launch configuration via the VSCode “Run/Debug” panel, and add some breakpoint, here we’ll just add a breakpoint at line where it says
$kernel = new DrupalKernel('prod', $autoloader);inside theweb/index.phpfile that will definitely get visited.
XDebug Outcome
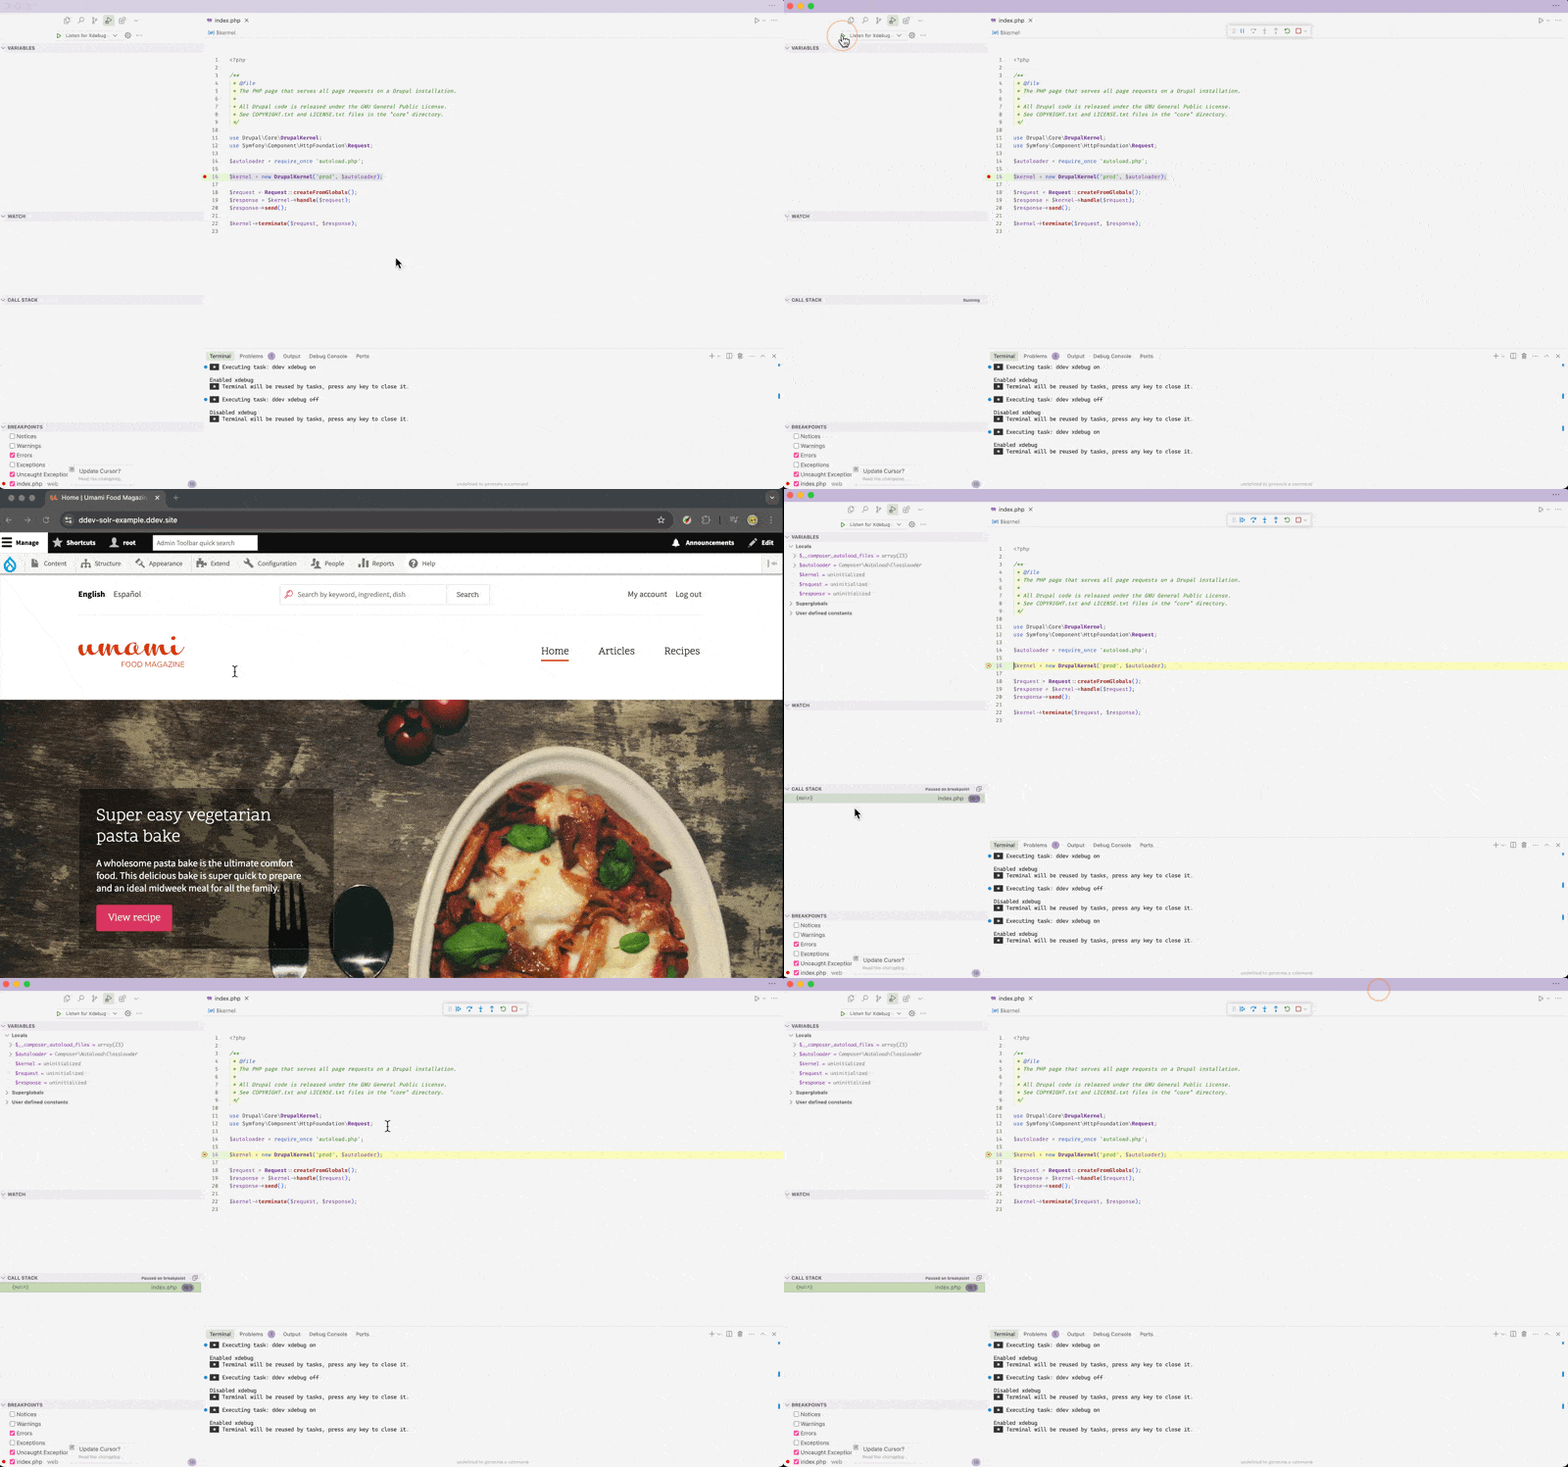
Now you can visit your drupal website using your browser, and you should be re-directed to the VSCode with the variables and stacks at the breakpoint we just set:
(Here’s’ a higher res-shot of VSCode for your reference: screenshot
