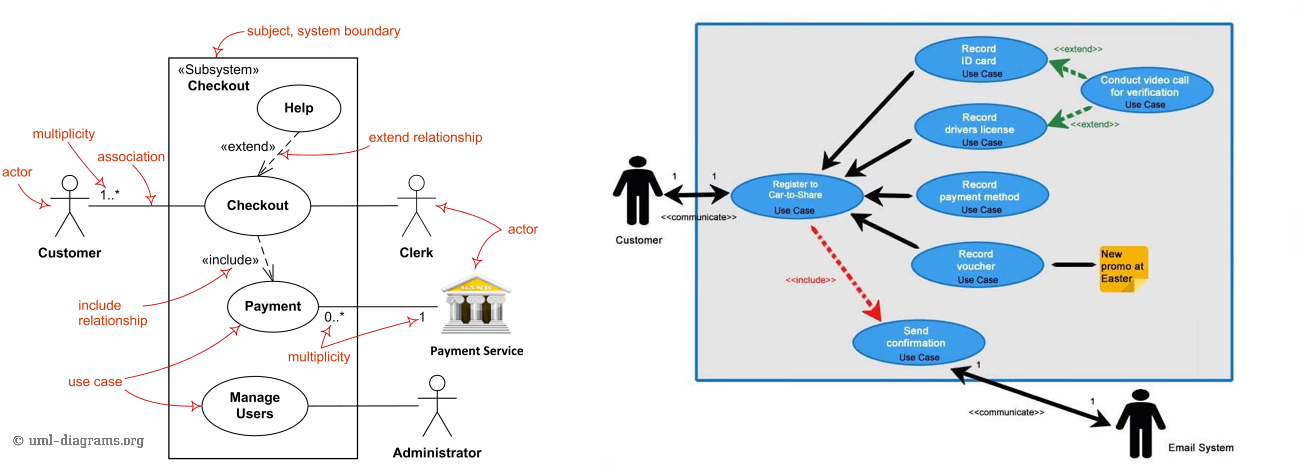
1. Use Case Diagram
A use case diagram is a behavioral UML (Unified Modeling Language) diagram that visually represents the interactions between users (actors) and a system to achieve specific goals. It depicts the functional requirements of a system from an external perspective, showing what the system does rather than how it does it. Use case diagrams consist of actors (represented as stick figures), use cases (represented as ovals), and the relationships between them (shown as lines). These diagrams help stakeholders understand the system’s scope, identify key functionality, and communicate requirements in a simple, accessible format. They serve as an excellent communication tool during requirements gathering and analysis phases of software development, allowing both technical and non-technical stakeholders to grasp the system’s purpose and functionality without delving into implementation details.
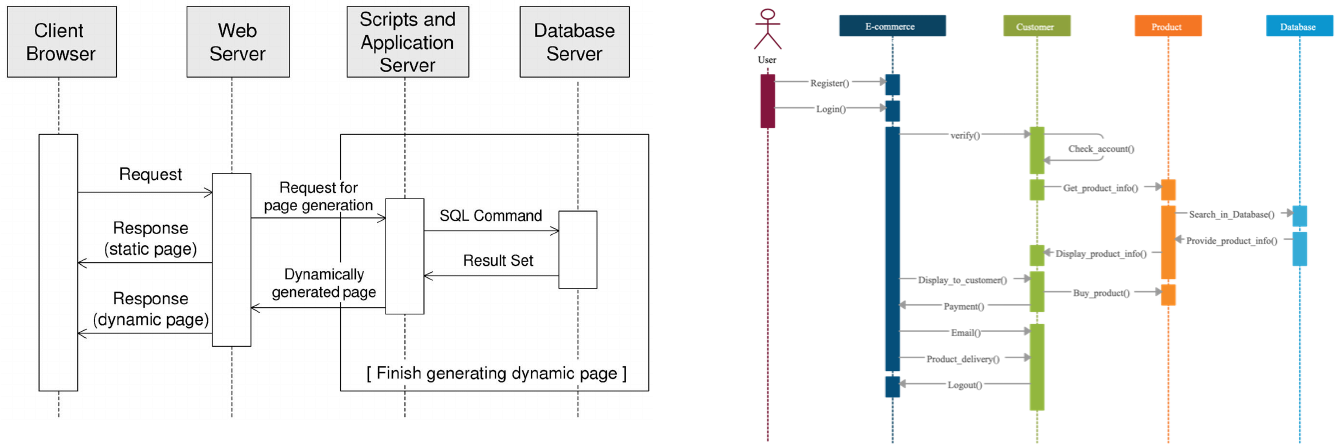
2. Sequence Diagram
A sequence diagram is a type of UML (Unified Modeling Language) interaction diagram that illustrates how objects interact with each other over time to complete a process or operation. It shows the chronological sequence of messages exchanged between objects, represented as vertical lifelines, with interactions depicted as horizontal arrows flowing from the sender to the receiver. Time progresses downward on the diagram, making it easy to visualize the temporal order of interactions. Sequence diagrams are particularly valuable for modeling dynamic behavior in systems, documenting complex scenarios, validating logic, and communicating how components collaborate to implement a specific use case. They provide developers, architects, and stakeholders with a clear visualization of message flows, method calls, and the overall interaction patterns between system components, making them essential tools for both system design and documentation.
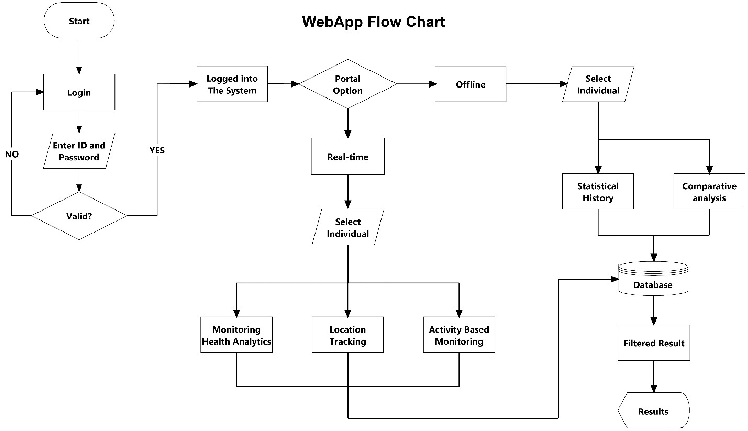
3. Flowchart / Activity Diagrams
A flowchart diagram is a graphical representation that uses standardized symbols to illustrate the sequence of steps, decisions, and processes within a workflow, algorithm, or system. It employs distinct shapes—rectangles for processes, diamonds for decisions, parallelograms for input/output, and arrows to show flow direction—creating a visual roadmap that makes complex procedures easier to understand. Flowcharts break down processes into logical components, clearly showing the path from start to finish, including alternative routes based on different conditions or decisions. Originally developed for computer programming and industrial engineering, flowcharts have become universal tools used across virtually all disciplines for process documentation, problem-solving, algorithm design, and communication. Their intuitive nature makes them particularly valuable for explaining complex procedures to diverse audiences, identifying inefficiencies in processes, standardizing operations, and serving as blueprints for implementation. Unlike other diagram types that may focus on system components or interactions, flowcharts specifically emphasize the sequential flow and decision logic of a process.
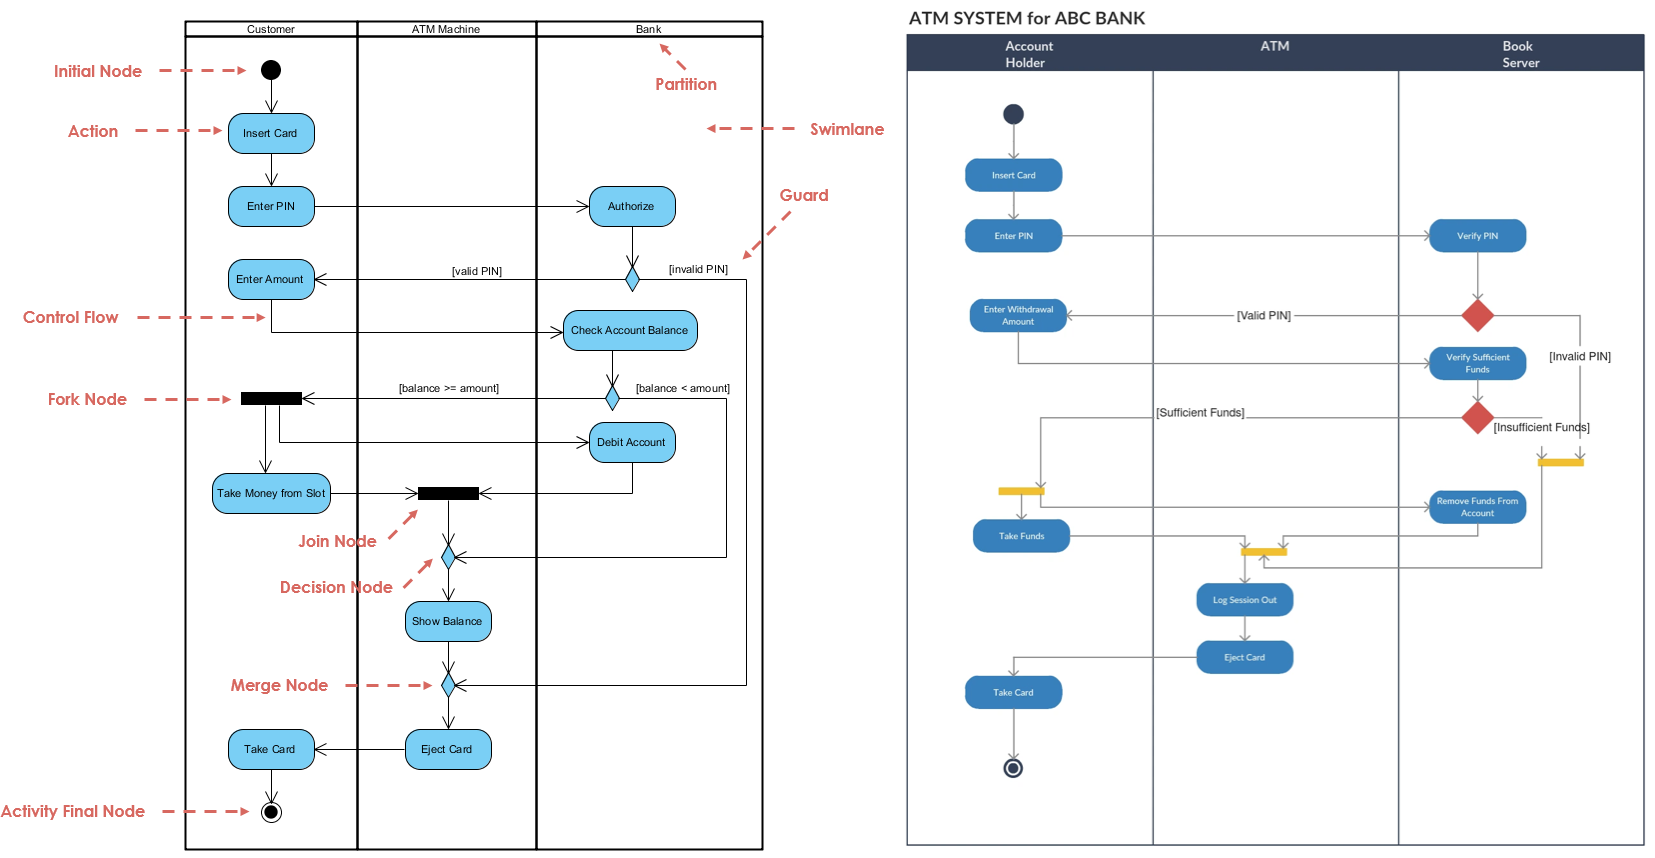
An activity diagram is a behavioral UML (Unified Modeling Language) diagram that visually represents the flow of actions, decisions, and concurrent operations within a system or business process. It uses symbols such as rounded rectangles for activities, diamonds for decisions, bars for parallel processing (fork and join), and arrows to show the flow direction. Activity diagrams are particularly effective at modeling workflows, business processes, and complex algorithms where conditional logic, parallel execution, or procedural steps need to be clearly visualized. Unlike sequence diagrams that focus on object interactions over time, activity diagrams emphasize the sequential or parallel flow of activities regardless of which objects perform them. They help stakeholders understand process logic, identify potential bottlenecks, and communicate complex procedural flows in an intuitive graphical format that bridges the gap between business requirements and technical implementation.
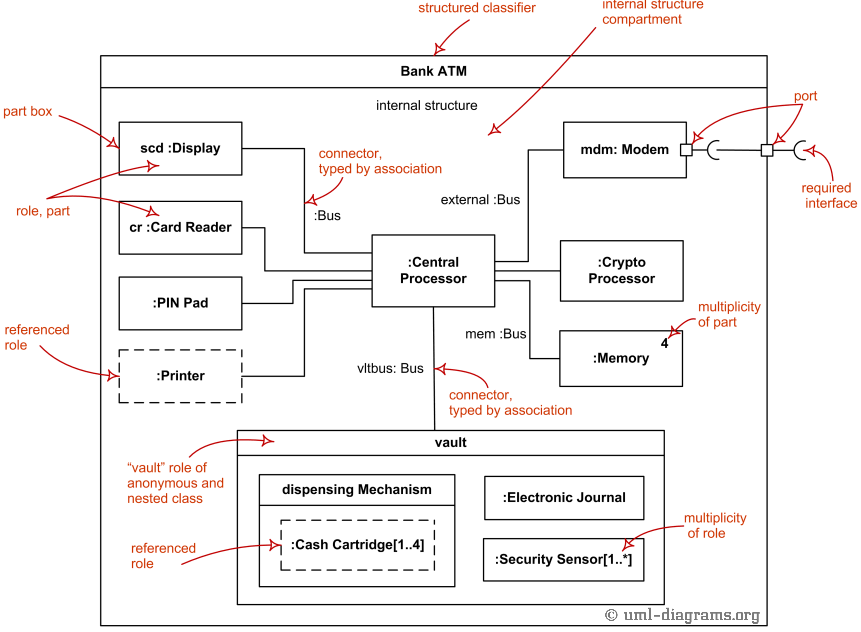
4. Composite Diagram
component, or collaboration, showing how its constituent parts are organized and interconnected to achieve the desired functionality. Unlike class diagrams that focus on static relationships between different classes, composite structure diagrams delve into the internal architecture of a single element, revealing its parts, ports, interfaces, and the communication paths between them. These diagrams are particularly valuable when modeling complex systems where understanding the internal composition and interactions within a component is crucial. They use symbols such as parts (representing internal elements), ports (defining interaction points), connectors (showing communication paths), and interfaces (specifying services offered or required). Composite structure diagrams help architects and developers visualize how components collaborate internally to fulfill their responsibilities, making them especially useful during detailed design phases of software development when implementing complex components with multiple interacting parts.
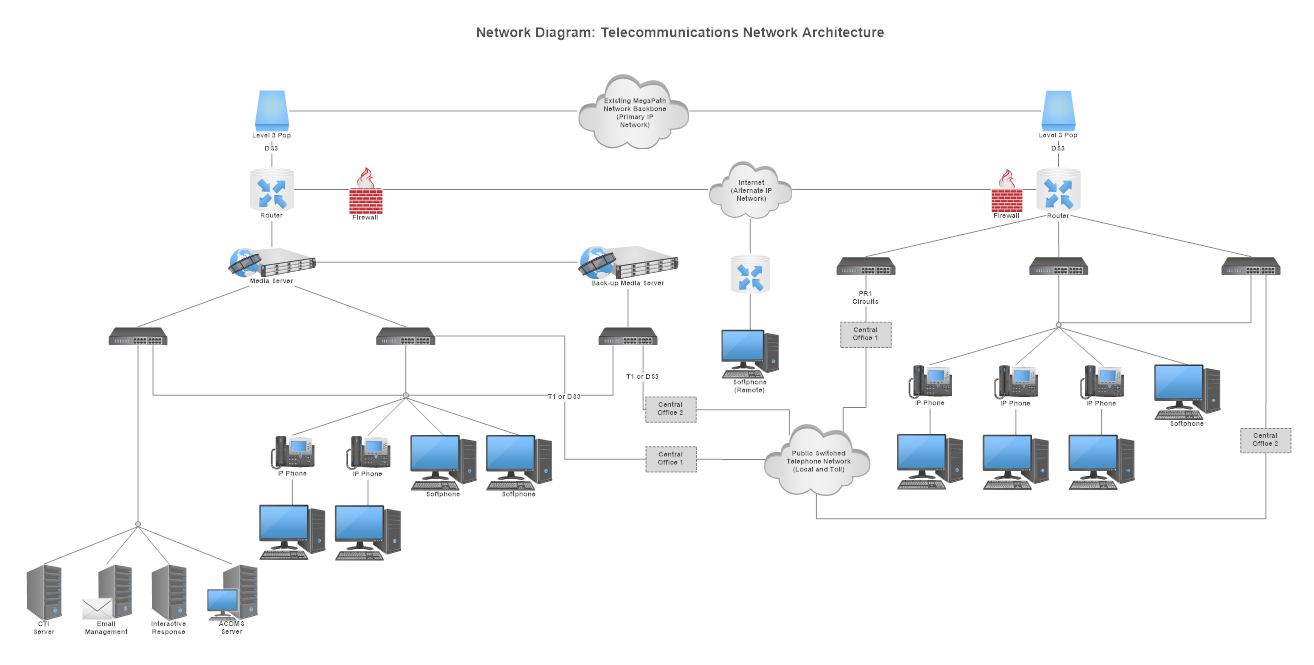
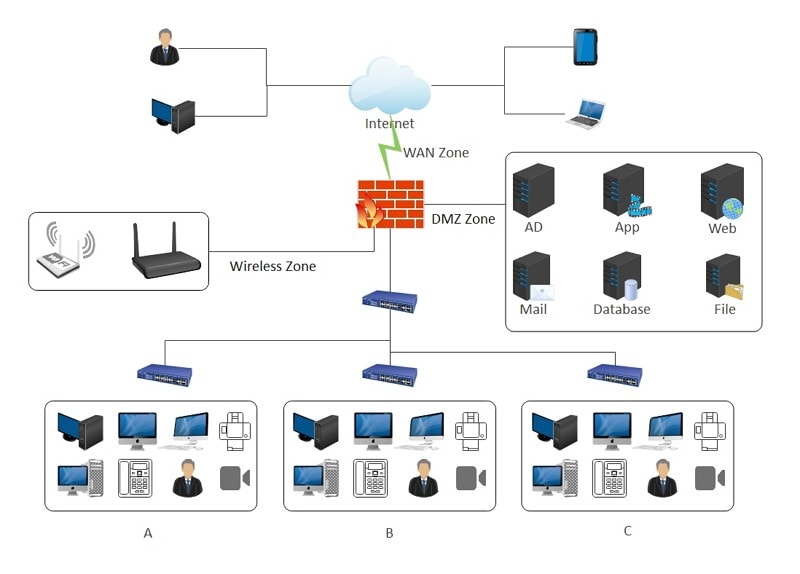
5. Network Diagram
A network diagram is a visual representation that illustrates the components, topology, and connections within a computer network or telecommunications system. It uses standardized symbols to depict various network devices (such as routers, switches, firewalls, servers, and workstations), connection media (like Ethernet cables, fiber optics, or wireless links), and their physical or logical relationships. Network diagrams can range from high-level conceptual overviews showing major network segments to detailed physical layouts documenting specific IP addresses, port configurations, and cable paths. These diagrams serve multiple critical purposes: they aid in network planning and design, facilitate troubleshooting by providing a visual reference of connectivity paths, support documentation requirements for compliance and knowledge transfer, and help communicate network architecture to both technical and non-technical stakeholders. Common types include physical network diagrams (showing actual hardware connections), logical network diagrams (depicting data flows regardless of physical implementation), and specialized diagrams like rack diagrams or wiring schematics.
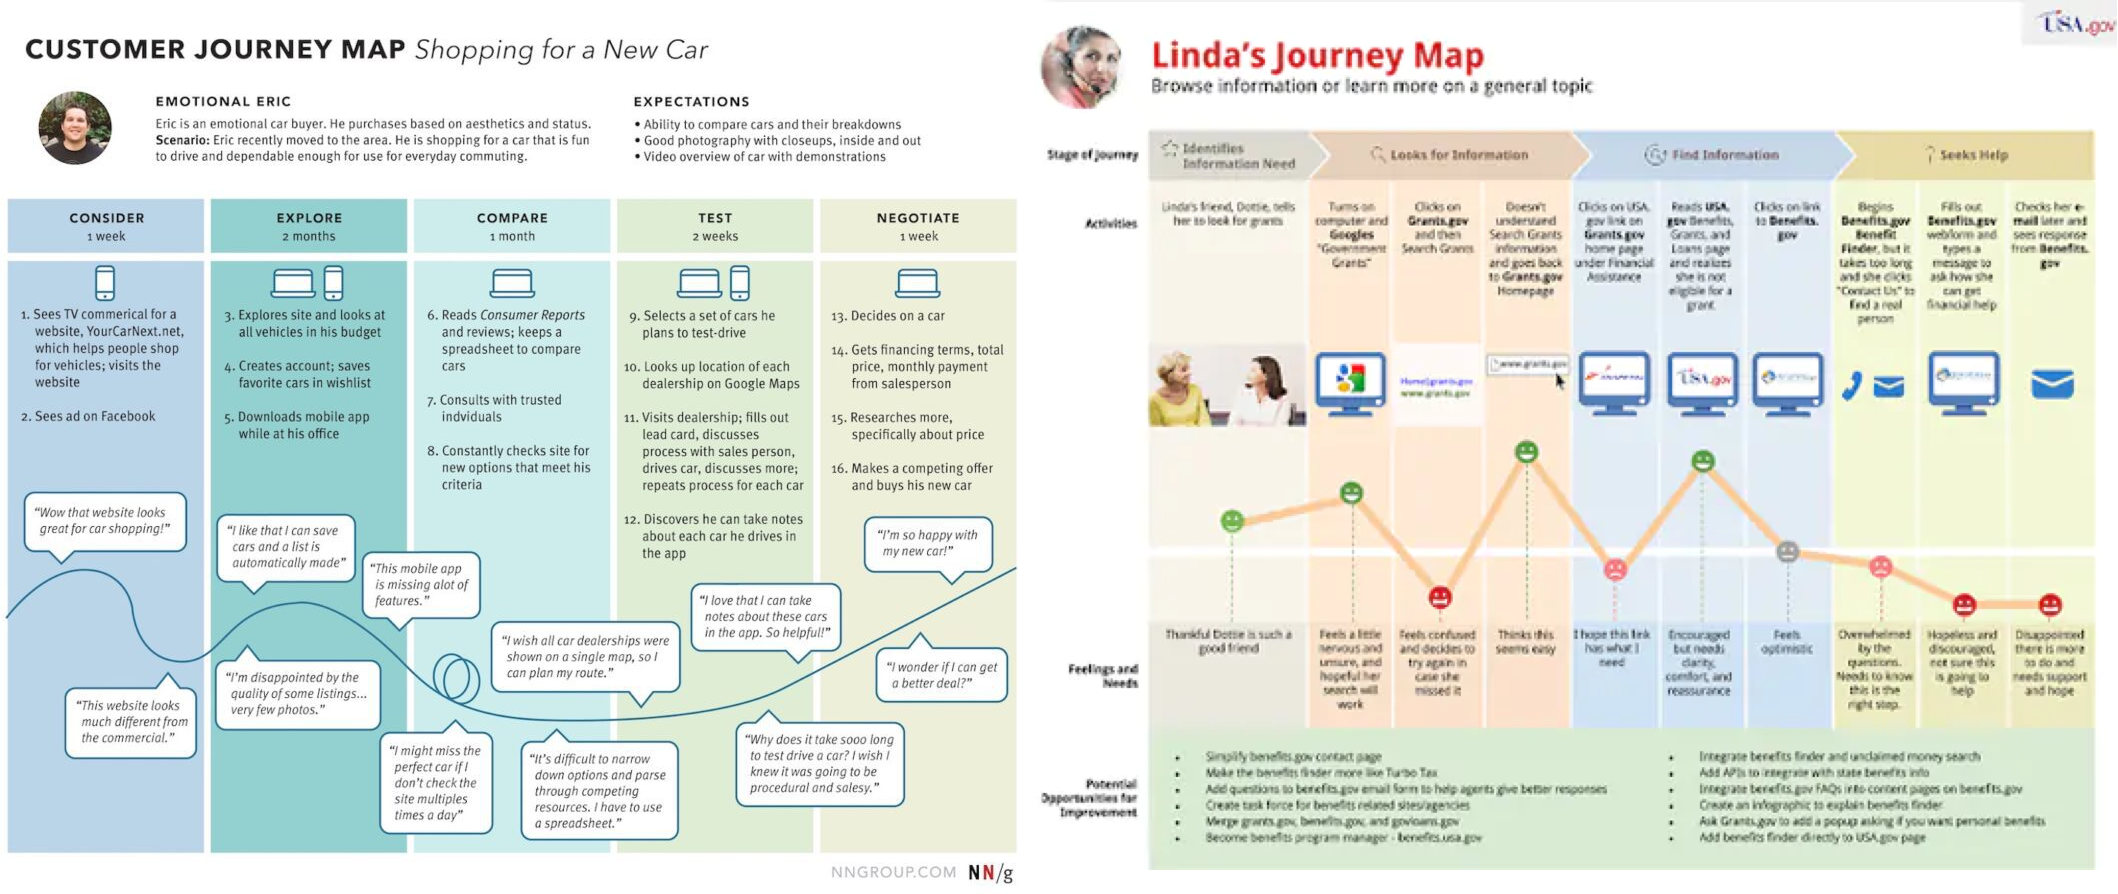
6. Customer Journey Map
A customer journey diagram is a visual representation that maps the complete experience a customer has when interacting with a company, product, or service across multiple touchpoints and channels over time. It chronologically illustrates each stage of the customer’s experience—from initial awareness through consideration, purchase, usage, and potentially loyalty or advocacy—highlighting their actions, thoughts, emotions, pain points, and moments of delight at each step. Unlike process-focused diagrams, customer journey maps specifically emphasize the emotional and experiential aspects of interactions, often incorporating customer personas, goals, expectations, and feedback. These diagrams serve as powerful tools for organizations to develop empathy for their customers, identify opportunities for improvement, align cross-functional teams around customer needs, prioritize resources, and design more cohesive, satisfying experiences. By visualizing the entire customer experience from the user’s perspective rather than the organization’s internal processes, customer journey diagrams help businesses bridge gaps between departments, eliminate friction points, and create more customer-centric products and services.
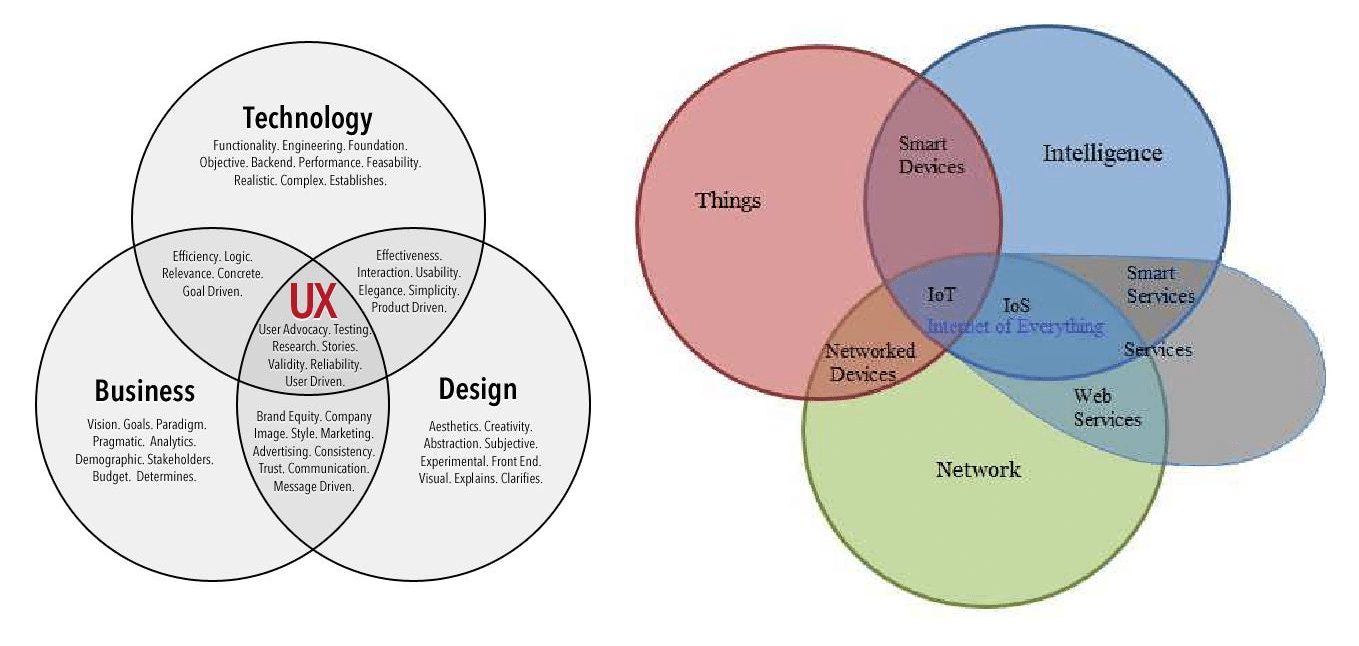
6. Venn diagram
A Venn diagram is a visual representation that uses overlapping circles or other shapes to illustrate the logical relationships between different sets or groups of items. Each circle represents a distinct category or set, while the overlapping regions show elements that belong to multiple sets simultaneously. Originally developed by mathematician John Venn in the 1880s, these diagrams are particularly effective at illustrating concepts of intersection (elements common to multiple sets), union (all elements in any set), difference (elements in one set but not another), and complement (elements not in a particular set). Venn diagrams can represent simple relationships between two or three sets, though more complex versions with additional sets are possible. They are widely used across disciplines including mathematics, statistics, logic, computer science, business, and education due to their intuitive nature and ability to clearly communicate set relationships. Venn diagrams help visualize complex relationships, identify commonalities and differences between groups, support decision-making processes, and simplify the understanding of set theory concepts for both technical and non-technical audiences.
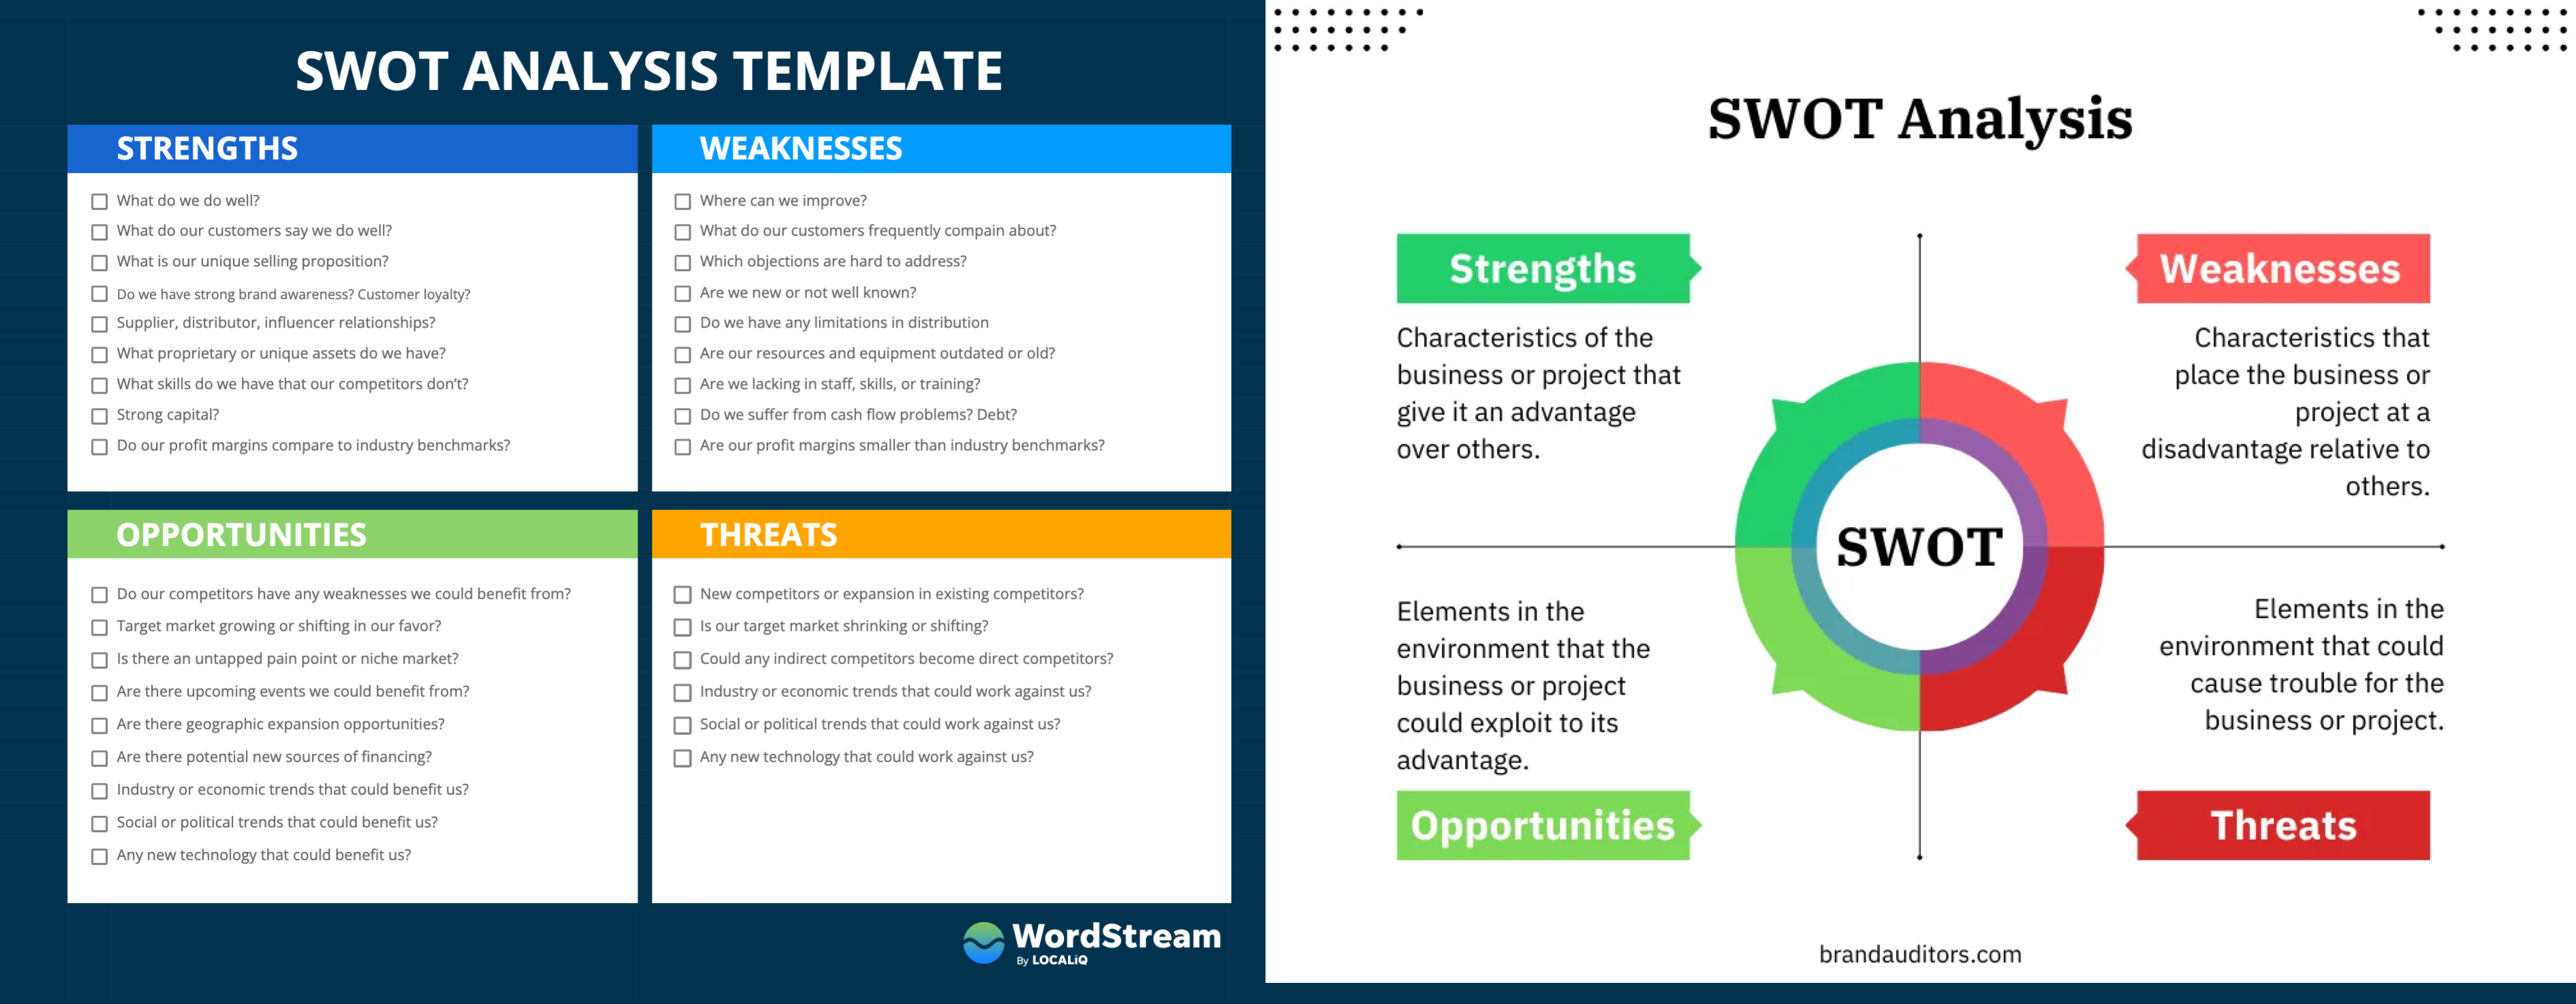
7. SWOT diagram
A SWOT diagram is a strategic planning tool that visually organizes an analysis of an organization’s Strengths, Weaknesses, Opportunities, and Threats into a structured four-quadrant matrix. The upper half typically addresses internal factors—Strengths (positive attributes and resources controlled by the organization) and Weaknesses (areas needing improvement or capabilities lacking)—while the lower half focuses on external factors—Opportunities (favorable external conditions that could provide advantages) and Threats (external challenges that could negatively impact performance). This simple yet powerful visual framework helps organizations gain a comprehensive understanding of their strategic position by simultaneously examining both internal capabilities and external environment. SWOT diagrams facilitate strategic decision-making by highlighting competitive advantages to leverage, vulnerabilities to address, market opportunities to pursue, and risks to mitigate. They are widely used across industries for business planning, project evaluation, personal development, and problem-solving due to their accessibility and effectiveness in synthesizing complex situational analyses into an easily digestible format that supports informed strategy development and resource allocation.
9. Other Diagrams
- Class
- Sequence
- Object
- Use case
- Activity
- State
- Communication
- Interaction overview
- Component diagrams
- Package diagrams
- Deployment diagrams
- Profile diagrams
- Composite structure diagrams
- Timing diagrams
- Unified-Modeling-Language (UM)Diagrams
- Entity-Relationship (ER) diagrams
- Flowcharts
- Matrix Diagram
- Circle Diagram
- Tree Diagram
- SWOT Analytsis Diagram
- Venn Diagram
- Organizational chart
- Fishbone diagram
- Pyramid or triangle chart
- Roadmap and Gantt chart