Quick Peek into “Watchdog” Table
(inside the drupal database)
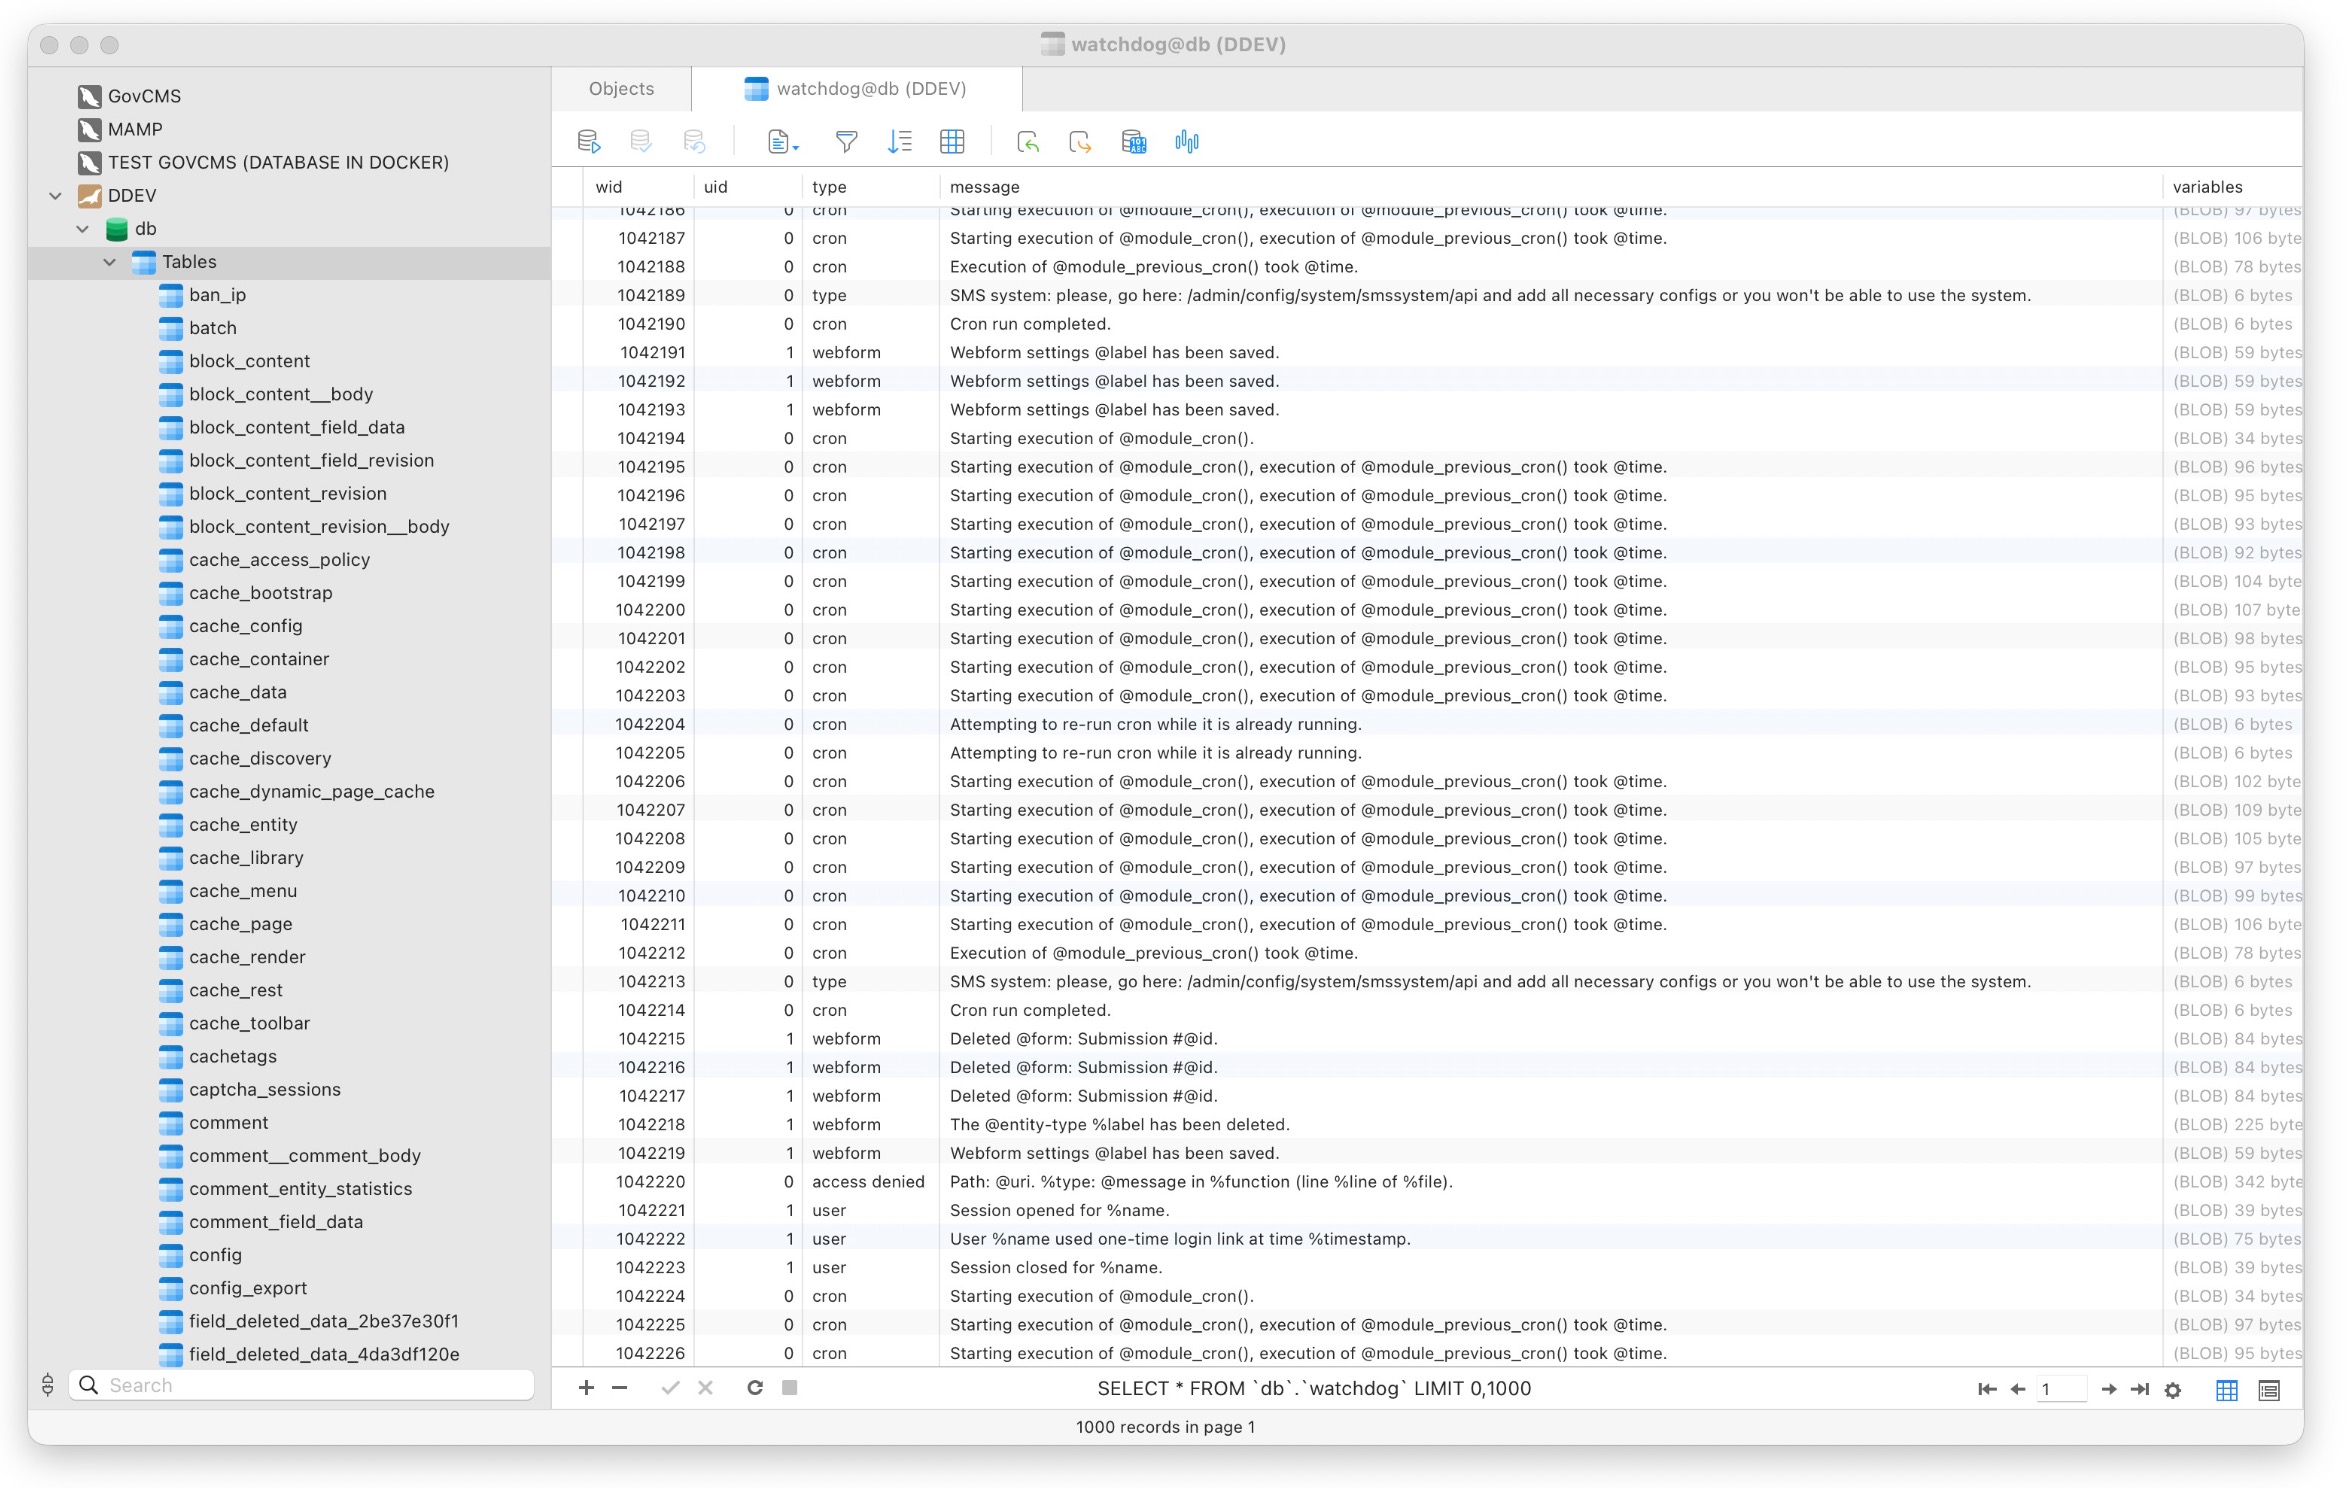
The watchdog table is Drupal’s system log table. It stores runtime messages generated by Drupal core, (contributed/custom) modules and themes—things like cron activity, errors, warnings, notices, and user actions.
What Each Column in Watchdog Table Means ?
- wid: Unique ID for each log entry.
- uid: The user ID responsible for the action. (
0= system / anonymous) - type: The source module or category of the message. (For instance:
cron→ Drupal cron job,webform→ Webform module,user→ User login/session activity,access denied→ Permission issues,php→ PHP-level log) - message: The log message itself (Often contains placeholders like:
@module,%time,@formin their code, which gets replaced at runtime using variables stored in the variable column) - variable: To store variables/placeholder such as
@module,%time,@formmentioned previously (Serialized data (BLOB))
Watchdog Logs in Drupal Backend
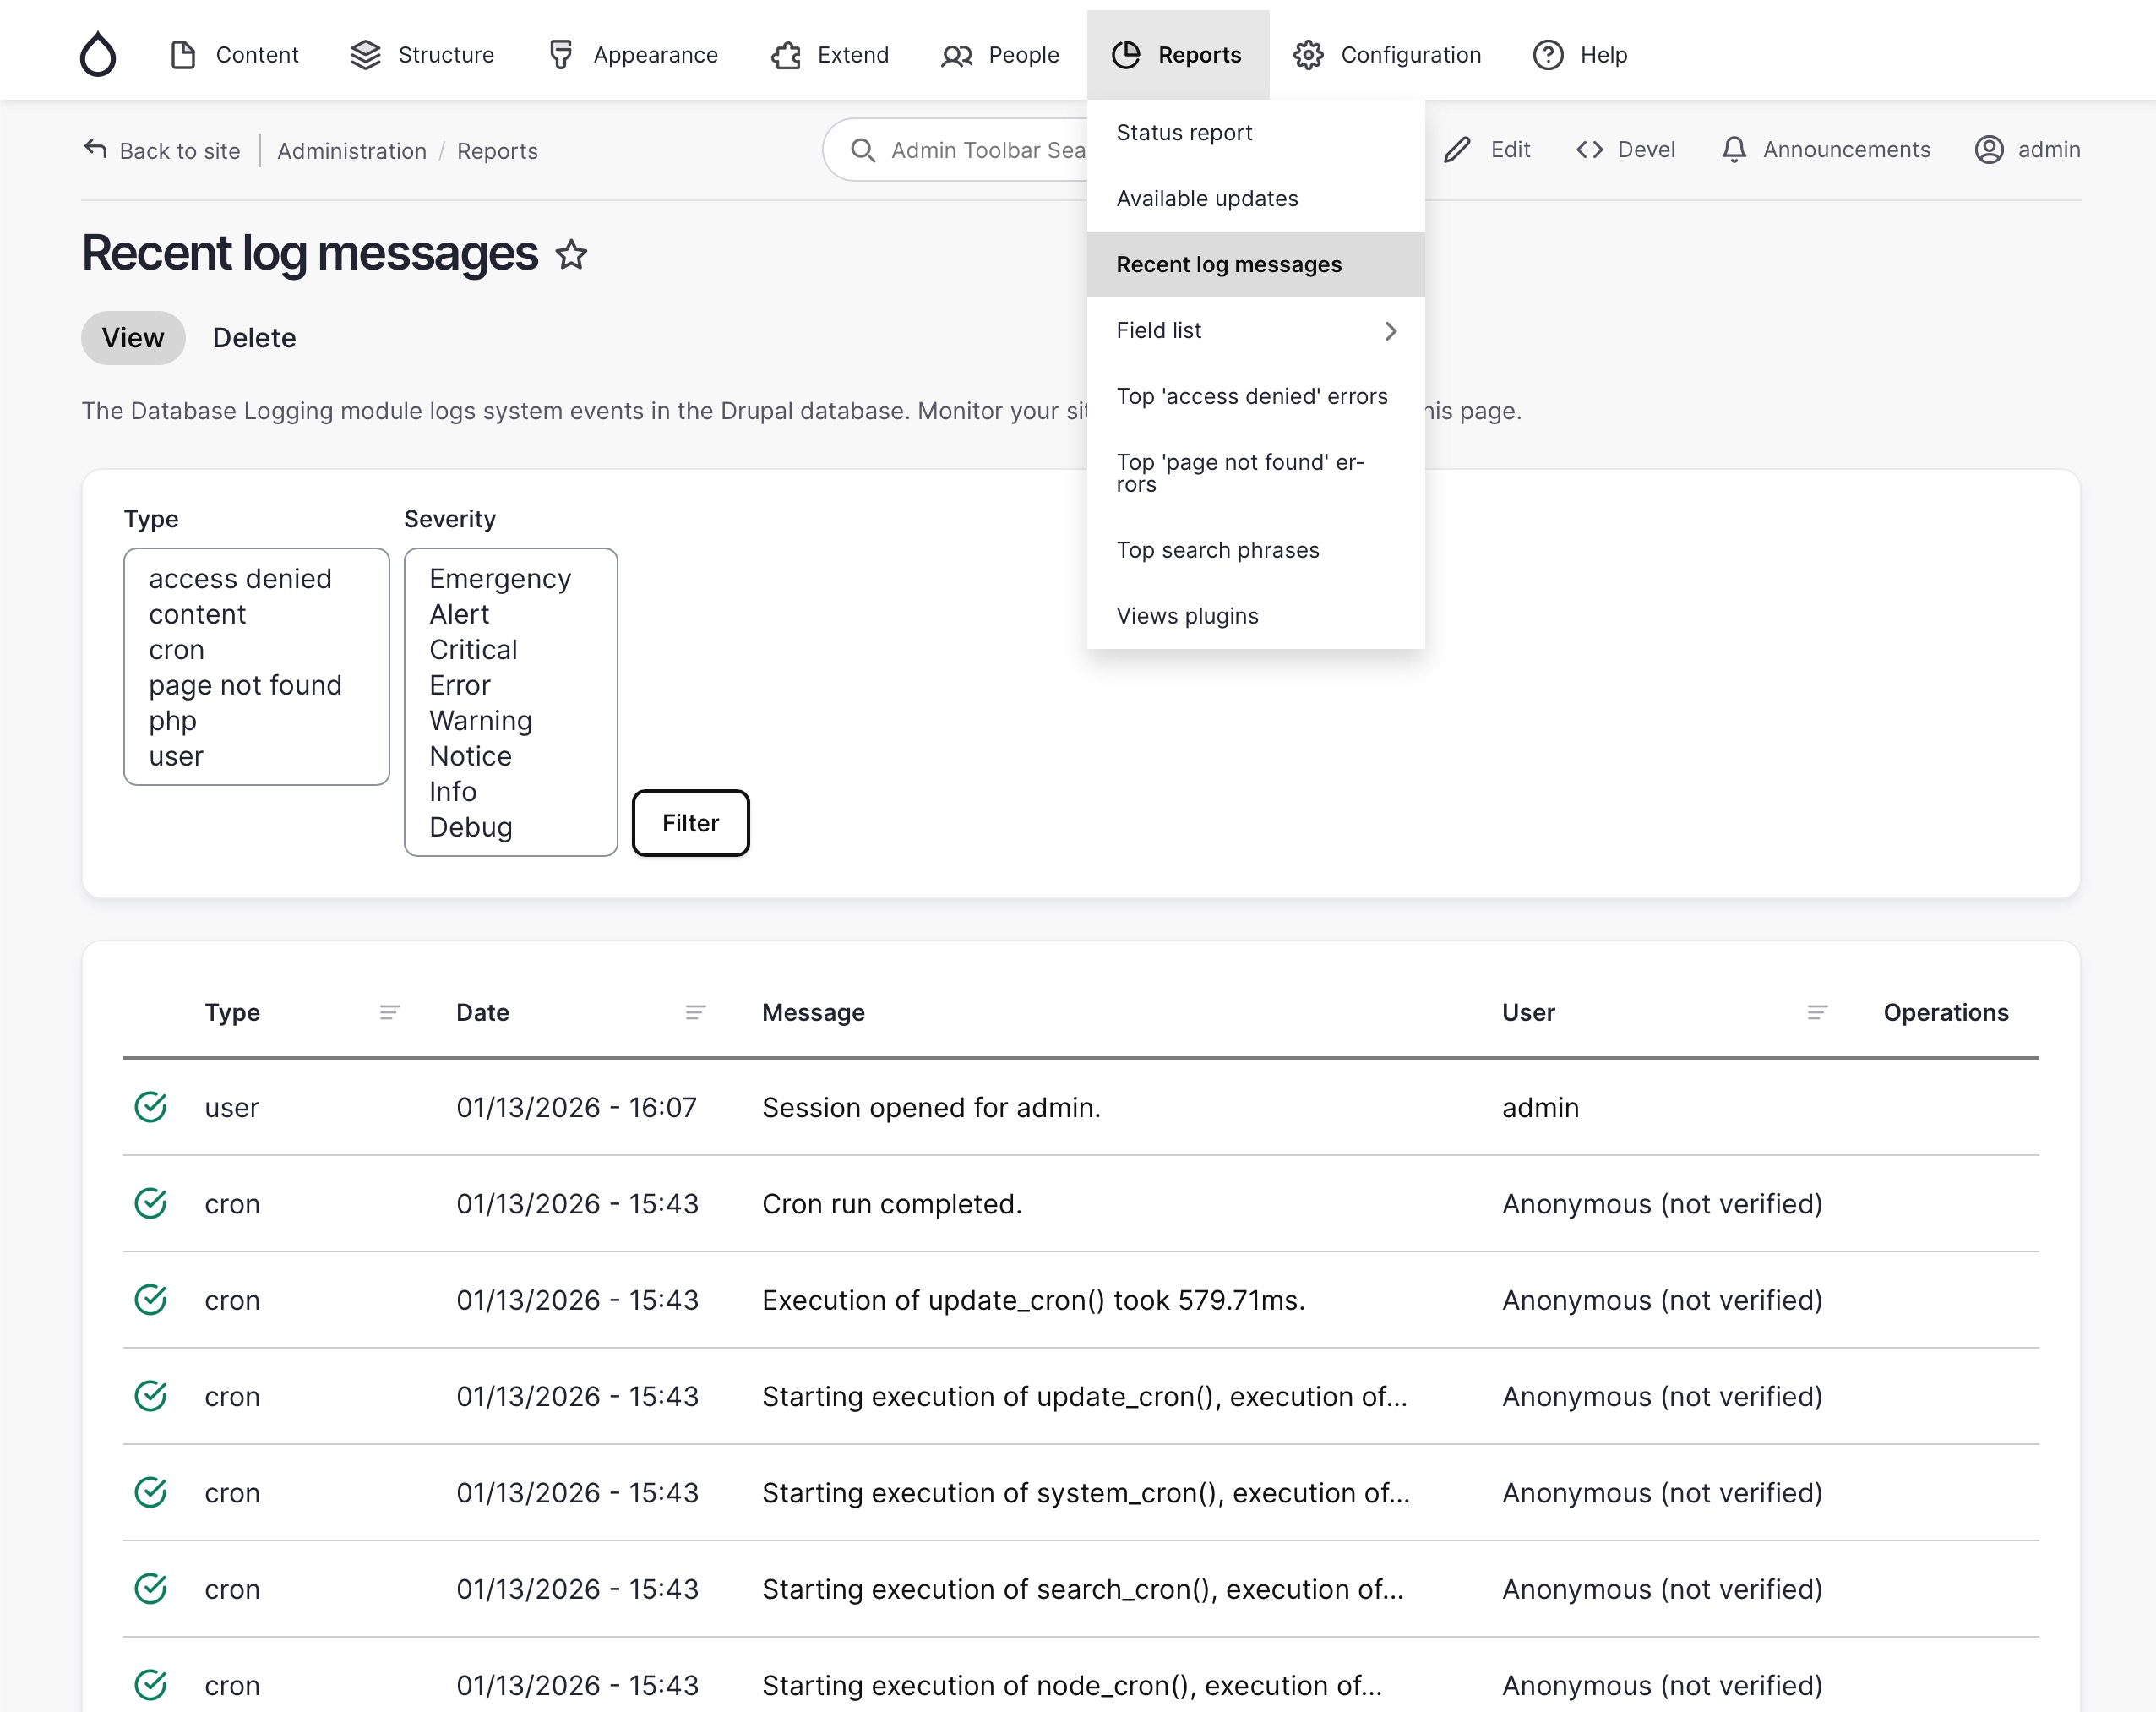
In the admin UI, this data appears as Reports → Recent log messages (/admin/reports/dblog)
Drupal Logging API
You can use the Drupal Logger API to log message into the watchdog table
| |
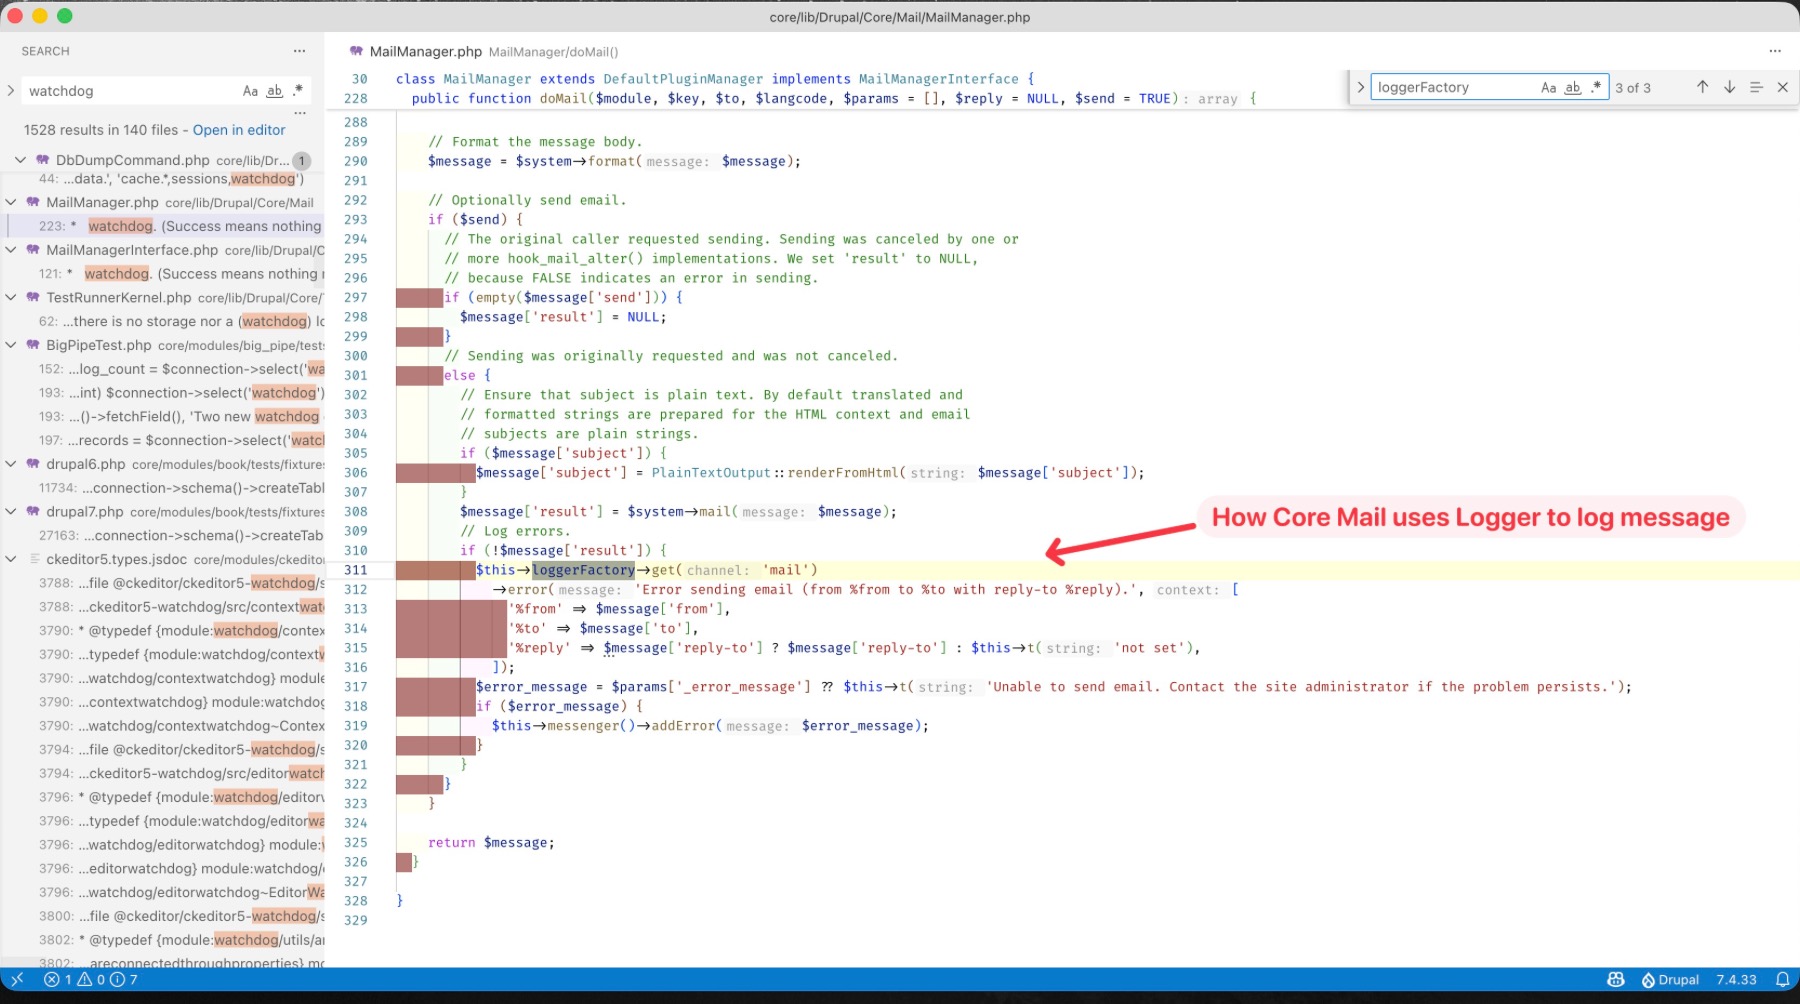
Alternatively, you can also use loggerFactory to create a logger instance that register to certain channel (message $type), below is an example, of how the Drupal core mail modules uses logger to log message into “mail” channel:
Drush Watchdog Command
Drush provides powerful commands for managing Drupal’s watchdog logs, primarily drush watchdog:show(or ws) for viewing recent logs with filtering by count, severity, or type, and drush watchdog:tail (or wt) for real-time monitoring, similar to tail -f, with options for filtering and extended details, plus drush watchdog:delete to clear log entries, all crucial for debugging and site maintenance.
drush watchdog:list: interactively filter the watchdog message listing1 2 3 4 5 6 7 8 9 10 11 12 13 14 15 16 17 18 19 20 21 22 23 24 25 26 27 28 29 30 31 32 33 34 35> drush watchdog:list ┌ Select a message type or severity level ─────────────────────┐ │ ○ == message types == ┃ │ │ ○ access denied │ │ │ ○ content │ │ │ › ● cron │ │ │ ○ page not found │ │ │ ○ php │ │ │ ○ user │ │ │ ○ == severity levels == │ │ │ ○ Emergency │ │ │ ○ Alert │ │ └──────────────────────────────────────────────────────────────┘ > <enter> ┌ Select a message type or severity level ─────────────────────┐ │ cron │ └──────────────────────────────────────────────────────────────┘ ------ -------------- ------ ---------- ---------------------------------------------------------------------------------- ID Date Type Severity Message ------ -------------- ------ ---------- ---------------------------------------------------------------------------------- 5527 13/Jan 13:28 cron Info Cron run completed. 5526 13/Jan 13:28 cron Info Execution of update_cron() took 872.52ms. 5525 13/Jan 13:28 cron Info Starting execution of update_cron(), execution of system_cron() took 184.09ms. 5524 13/Jan 13:28 cron Info Starting execution of system_cron(), execution of search_cron() took 11394.97ms. 5523 13/Jan 13:27 cron Warning Attempting to re-run cron while it is already running. 5522 13/Jan 13:27 cron Warning Attempting to re-run cron while it is already running. 5521 13/Jan 13:27 cron Warning Attempting to re-run cron while it is already running. 5520 13/Jan 13:27 cron Info Starting execution of search_cron(), execution of node_cron() took 11.94ms. 5519 13/Jan 13:27 cron Info Starting execution of node_cron(), execution of history_cron() took 0.54ms. 5518 13/Jan 13:27 cron Info Starting execution of history_cron(), execution of file_cron() took 13.44ms. ------ -------------- ------ ---------- ----------------------------------------------------------------------------------drush watchdog:tail: tail (monitor/watch) watchdog message1 2 3 4 5 6 7 8 9 10 11 12 13 14 15 16 17 18 19 20 21 22 23 24 25 26 27 28 29 30> drush watchdog:tail 5527 13/Jan 13:28 cron Info Cron run completed. 5526 13/Jan 13:28 cron Info Execution of update_cron() took 872.52ms. 5525 13/Jan 13:28 cron Info Starting execution of update_cron(), execution of system_cron() took 184.09ms. 5524 13/Jan 13:28 cron Info Starting execution of system_cron(), execution of search_cron() took 11394.97ms. 5523 13/Jan 13:27 cron Warning Attempting to re-run cron while it is already running. 5522 13/Jan 13:27 cron Warning Attempting to re-run cron while it is already running. 5521 13/Jan 13:27 cron Warning Attempting to re-run cron while it is already running. 5520 13/Jan 13:27 cron Info Starting execution of search_cron(), execution of node_cron() took 11.94ms. 5519 13/Jan 13:27 cron Info Starting execution of node_cron(), execution of history_cron() took 0.54ms. 5518 13/Jan 13:27 cron Info Starting execution of history_cron(), execution of file_cron() took 13.44ms. (Now run 2026-01-13T15:43:00 run cron job ... get more logs !) 5528 13/Jan 15:43 user Info Session opened for admin. 5540 13/Jan 15:43 cron Info Cron run completed. 5539 13/Jan 15:43 cron Info Execution of update_cron() took 579.71ms. 5538 13/Jan 15:43 cron Info Starting execution of update_cron(), execution of system_cron() took 44.81ms. 5537 13/Jan 15:43 cron Info Starting execution of system_cron(), execution of search_cron() took 42.43ms. 5536 13/Jan 15:43 cron Info Starting execution of search_cron(), execution of node_cron() took 10.26ms. 5535 13/Jan 15:43 cron Info Starting execution of node_cron(), execution of history_cron() took 0.25ms. 5534 13/Jan 15:43 cron Info Starting execution of history_cron(), execution of file_cron() took 7.24ms. 5533 13/Jan 15:43 cron Info Starting execution of file_cron(), execution of field_cron() took 2.34ms. 5532 13/Jan 15:43 cron Info Starting execution of field_cron(), execution of dblog_cron() took 2.37ms. 5531 13/Jan 15:43 cron Info Starting execution of dblog_cron(), execution of comment_cron() took 11.25ms. 5530 13/Jan 15:43 cron Info Starting execution of comment_cron(), execution of announcements_feed_cron() took 1.12ms. 5529 13/Jan 15:43 cron Info Starting execution of announcements_feed_cron(). (Continue monitoring for new logs ...)drush watchdog:show-one: show one log record of certain ID1 2 3 4 5 6 7 8 9 10 11> drush watchdog:show-one 5527 # show log of ID 5527 wid: '5527' uid: '0' type: cron message: 'Cron run completed.' severity: Info location: 'https://stage.opctest.com.au/apple-touch-icon-precomposed.png' hostname: 220.245.32.230 date: '13/Jan 13:28' username: Anonymousdrush watchdog:show: show a listing of most recent 10 messages1 2 3 4 5> drush watchdog:show # show a listing of most recent 10 messages > drush watchdog:show --count=123 # show a listing of most recent 123 messages > drush watchdog:show --type=php # show a listing of 10 recent php logs > drush watchdog:show --severity=Notice # show a listing of 10 recent Notice logs > drush watchdog:show --severity-min=Warning # show a listing of most recent 10 messages with a severity of warning or higher.
Reference
Drupal Logger API
Drush Watchdog Commands